







About this collection
Every Fiverr gig lives or dies by a single image. Each cover here respects the real constraints of a gig image - one banner-shaped canvas, high-contrast text, and no clutter that would collapse at small sizes.
These are starting points, not finished listings. Every cover here is built around one idea: a single service promise, set in type large enough to survive being shrunk into Fiverr's search grid. The collection spans roughly thirty service areas — software and app development, design and branding, writing and translation, marketing, audio, data, and business consulting — so you can usually find a layout close to what you sell and adapt it.
Nothing here is a layered design file. Each one is a flat generated image, which is exactly what makes it quick: pick a layout, swap the headline, palette, and icons for your own service, and you have a listing image in a few minutes rather than an afternoon.
What a gig cover actually has to do
A buyer scanning search results sees your cover as a thumbnail no wider than a postage stamp, sitting next to a dozen competitors. That single constraint decides almost everything else:
- One promise, not a service list. "I will fix your WordPress site in 24 hours" reads at thumbnail size. "WordPress | SEO | Speed | Security | Maintenance" turns to mush.
- High contrast between text and background. Thin light type on a pale panel is the first thing to disappear when the image shrinks.
- Three to six words in the headline. Long headlines force small type, and small type is what becomes unreadable first.
- The service visible before reading a word. A layout cue — a device frame, a waveform, a chart, a colour swatch — tells the buyer the category instantly.
Resizing and export
Fiverr publishes its own requirements in the uploader, and they change - check them there rather than trusting a number quoted in a blog post. What does not change is the direction of the resize: always scale down from the download. Never upscale a smaller image to reach the uploader's width, because the text edges go soft, and soft type is exactly what a thumbnail cannot afford.
When you trim to match the uploader's proportions, do it symmetrically and keep the headline centred, so the crop does not eat one side of the promise.
Three things worth doing before you upload
- Judge the thumbnail, not the full-size file. Shrink the preview down to search-result size, or just squint. If the promise still reads, the cover works. 2. Keep a colour system across your gigs. Buyers skim a grid of near-identical covers; a consistent accent colour makes your listings recognisable among strangers. 3. Leave the outer margin clear. Gig images get cropped slightly differently across placements, so keep text away from the outer edge of the canvas.
Common questions
Will the downloaded cover meet Fiverr's upload requirements?
Check the uploader: Fiverr shows its current accepted format, file limit and recommended image spec there, and those are the platform's requirements, not ours. What matters on this side is direction — start from the downloaded cover and scale down to fit, never up from a smaller file.
Will the text still be readable in the search grid?
Shrink it to search-result size before uploading. That is close to what buyers actually see when comparing gigs, and it is where most covers fail — usually because the headline was set too small or the contrast was too low to begin with.
How many images should one gig have?
Fiverr's gallery takes up to three images and two videos. Lead with the strongest cover, then spend the remaining slots on a work sample, a before-and-after, or a deliverable preview rather than more headline art.
Can I use the same cover on several gigs?
No. Buyers often see two or three of your gigs together, and identical covers make them look like one listing repeated. Change the headline, the accent colour, and the main visual so each gig reads as its own service.
Can I change the text or colours after generating?
Not in place. The wording is baked into the image, so there is no text layer to retype. Download it and edit it in your own tool, or use the "Use as Template" option to regenerate it with different copy.
Why do the covers in this collection look so different from each other?
Because the range is deliberately broad. Each cover was written around the specific service it advertises, so a logo animation cover and a translation cover share a job — selling one service at thumbnail size — but not a visual style. That variety is what lets you give every gig a distinct look.
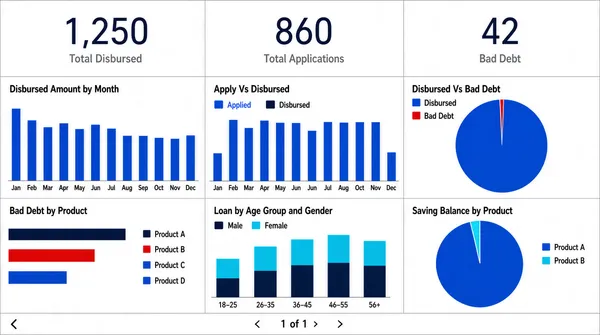
![[Format]
Landscape 16:9 gig cover, flat dashboard-UI screenshot on white. Uniform panel grid, hairline rules, clinical reporting look. No watermark, no personal names.
[Layout]
Edge-to-edge screenshot, no device frame. The canvas is a strict two-band grid. The top band is a single row of three equal white cards, each carrying one very large thin dark numeric figure centred, with a small grey caption beneath it. The lower band is a three-column by two-row grid of white panels separated by thin grey rules, each panel containing a chart: a column chart with twelve labelled bars; a grouped column chart with two long series over a year axis and a two-entry legend; a large single-slice pie with a tiny sliver; a red, blue and cyan horizontal bar chart with a long category legend to its right; a stacked column chart with two colour families over an age-group axis and a legend; and a second large pie with a small wedge and a legend list. A thin pagination strip runs along the very bottom with a small glyph on the left and a page indicator with arrow buttons at the centre.
[Subject]
None — UI only.
[Headline]
Panel titles in small dark title case across the top-left of each panel: "Disbursed Amount by Month", "Apply Vs Disbursed", "Disbursed Vs Bad Debt", "Bad Debt by Product", "Loan by Age Group and Gender", "Saving Balance by Product". The three top cards carry captions reading three short financial metric names under their large figures. Axis labels and month or category names run along the baselines. A page indicator at the bottom reads a small number-of-pages string. Render all wording as neutral placeholder copy in the same positions and weights.
[Badges]
A tiny product name sits at the very bottom-left corner — replace it with neutral placeholder text or omit it. No other marks.
[Mood]
Predominantly white with a cobalt-blue family plus red, cyan and dark navy accents in the charts. Plain, bank-report thorough; the three oversized top figures give the thumbnail its spine.](https://files.posterlet.com/assets/generated/md/9y3y93xcm0wj.webp)
![[Format]
Landscape 16:9 gig cover, dark premium hero collage with device mockups and 3D props. Glossy, layered, dramatic lighting. No watermark, no personal names.
[Layout]
Full-bleed very dark brown-black ground with warm light pooling behind the centre and a subtle perspective grid on the floor. The composition is layered front to back in three depths. Back layer: two large dashboard panels floating left and right, partially cropped by the frame edges, each tiled with small Power BI charts. Middle layer: a huge centred three-dimensional headline with a ribbon banner beneath it, dominating the upper half. Front layer: a laptop mockup at the lower-left, angled so its screen and keyboard deck both show, its screen filled with a light Power BI dashboard; a 3D gold ascending arrow sweeping up through the middle-right across a set of gold bars and blocks; and a short column of four icon-plus-label rows at the middle-right. A full-width dark band runs along the very bottom edge holding a single centred call to action.
[Subject]
None — device mockups and 3D props only.
[Headline]
Centre, in a heavy three-dimensional extruded face with a metallic sheen: "POWER" in white and "BI" in bright gold on one line, the largest element. Beneath it a shallow gold ribbon banner carrying "EXPERT" in heavy dark uppercase. Below the ribbon, a two-part subtitle in white and gold uppercase reading "PROFESSIONAL DASHBOARDS & REPORTS". The four right-hand rows read "Custom Interactive Dashboards", "Data Visualization & Analysis", "KPI & Metrics Reports", "Fast Delivery & Support" in bold light title case with gold icons. The bottom dark band carries a single uppercase call to action in white with the last word highlighted gold.
[Badges]
The small label at the top-right is the Power BI lockup — the Power BI logo, a gold ascending three-bar mark, beside the white "Power BI" wordmark. The floating dashboard panels and the laptop screen are Power BI reports filled with charts and small coloured KPI tiles. The gold bars, the 3D ascending arrow and the stacked blocks at the lower-left are decorative 3D geometry rather than brand marks.
[Mood]
Near-black brown with rich gold 3D props, warm rim light and white type. Cinematic, premium, high-production; the extruded headline and the glow behind it make an unmistakable thumbnail.](https://files.posterlet.com/assets/generated/md/hasvj7h2mnfe.webp)
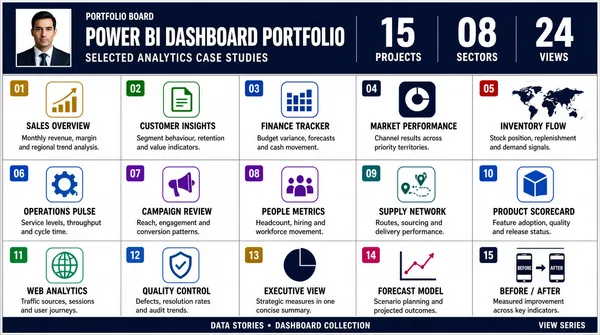
![[Format]
Landscape 16:9 gig cover, dense multi-panel portfolio grid in a presentation-board style. Small type, many numbered cells, thin rules. No watermark, no personal names.
[Layout]
This is a genuine multi-panel grid cover, not a single hero. The frame is divided into a dark navy header band across the top (roughly a fifth of the height) and below it a five-column by three-row grid of white cells with hairline gutters and a thin outer border, plus a slim dark footer bar along the bottom edge. Inside the header band, left to right: a small square portrait block, a column of headline text with a small icon row beneath it, and at the right a cluster of three large statistic figures with short labels under each. The grid cells are each numbered in a small coloured square at the top-left and carry a short icon, a two-or-three-word title, a few lines of small grey copy, and where relevant a thumbnail chart graphic — line charts, donut charts, bar clusters, a small world map, a small device icon and a small before-after pair. Cells read left to right, top to bottom, in numeric order.
[Subject]
The header band contains one small square portrait of a person — a man in a dark suit, head-and-shoulders, neutral expression — treated as a small block, not a cut-out. No other figures anywhere in the grid.
[Headline]
Header band: heavy white uppercase "POWER BI DASHBOARD PORTFOLIO" with a smaller lighter subtitle beneath it; a short dark label above the title; three large statistic figures at the right with small captions. Grid cells each carry a small bold dark title of two or three words plus a few lines of small grey body copy, and a numbered chip in the top-left corner of every cell running from one upward. The footer bar carries a short centred caption with a small separator and a right-aligned sign-off line. Render all names, handles and product words as neutral placeholders of similar length.
[Badges]
Each cell's icon is a small flat rounded-square mark in one of a small set of colours — describe them only as pure geometry and colour (a gold ascending-bar mark, a green document mark, a blue grid mark, a violet ring mark, a dark disc mark and so on). The header's icon row is a set of tiny coloured rounded squares. The footer contains a small rounded social-style glyph; render as a plain shape. No real product, vendor or platform names anywhere.
[Mood]
Overall white with a deep navy header and footer, plus a controlled set of accent colours (gold, green, blues, violet, red) identifying each numbered cell. Information-dense, catalogue-like; at thumbnail size it reads as a busy, credible portfolio board rather than a single image.](https://files.posterlet.com/assets/generated/md/z0t4ek7nk1ke.webp)
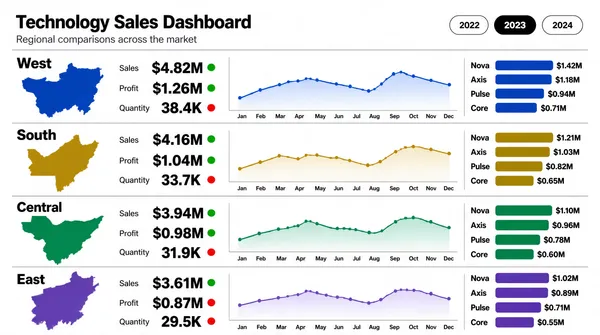
![[Format]
Landscape 16:9 gig cover, flat analytical reporting layout on white. Systematic, spreadsheet-clean, colour-coded rows. No watermark, no personal names.
[Layout]
A plain white field with no chrome. A title block sits at the top-left with a two-line heading and a small legend line beneath it. At the top-right, a cluster of three rounded pill tabs sits in a horizontal row. Below, the body is a vertical stack of four identical full-width rows, tightly aligned to the same internal grid so they read as a repeating unit; a hairline rule separates each. Every row contains, in order from the left: a region label with a small coloured map silhouette beneath it and a row of three small delta chips at its base; a block of three stacked figures each with a bold value over a light label and a delta chip; a wide line chart with a pale gradient fill and month labels along the base; and at the far right a short vertical stack of four category rows, each a name with a bold value and a horizontal bar in the row's accent colour. The four rows step through four different accent colours in sequence.
[Subject]
None — data layout only.
[Headline]
Top-left heading in bold near-black sans: "Technology Sales Dashboard", with a smaller grey subtitle line beneath it describing regional comparisons across a market. Region labels down the left edge of each row read "West", "South", "Central" and "East" in bold. Within each row the metric labels read "Sales", "Profit" and "Quantity" in small grey caps over large bold dark values, each followed by a tiny green or red delta chip. The right-hand category lists use short product-style names with bold figures beside coloured bars. The three top-right pill tabs hold three short year labels, the middle one filled solid black with white text.
[Badges]
None — the only graphics are the small abstract map silhouettes in each row's accent colour and the delta chips.
[Mood]
White with four distinct accent families — cobalt blue, olive gold, emerald green and violet — repeating down the stack. Ordered, comparative, report-clean; the four colour bands give the thumbnail an instantly readable rhythm.](https://files.posterlet.com/assets/generated/md/f28jujjk689b.webp)
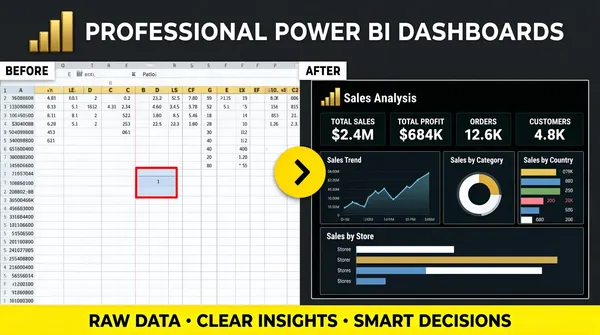
![[Format]
Landscape 16:9 gig cover, flat business banner with two contrasting panels. Clean, high-contrast, before-after framing. No watermark, no personal names.
[Layout]
Full-bleed dark charcoal ground. A single headline row runs across the top under the Power BI logo glyph. The body is a strict horizontal split down the middle: the left half is one large light Excel-style spreadsheet panel that bleeds off the left, top and bottom edges, filled with a pale grid of many tiny numeric cells, a coloured header row of column letters, and one cell outlined in red near its centre; the right half is one large dark Power BI dashboard panel, its header reading "Sales Analysis" beside the Power BI mark, with a bright hairline border, its interior tiled with four KPI mini-cards, a line chart, a ring chart, a small bar-by-month chart, a country bar list and a wide bar-by-store chart. Straddling the split point, a small bright-yellow circular arrow button with a black chevron sits over the seam, signalling the transition. A full-width accent bar runs along the bottom edge.
[Subject]
None — UI panels only.
[Headline]
Top row: the Power BI logo — a small gold 3D ascending-bar glyph — at the far left beside a heavy white uppercase headline reading "PROFESSIONAL POWER BI DASHBOARDS", left-aligned on one line. Two small corner labels sit at the top of each panel: a white tab reading "BEFORE" over the light grid and a matching tab reading "AFTER" over the dark dashboard. Inside the dark panel a small panel title with a tiny line-chart glyph sits above four KPI labels and bold figures, plus small tile captions for the ring chart, the bar list and the wide bar chart. The bottom accent bar carries three short bold phrases separated by centred dots.
[Badges]
The small gold ascending-bar glyph at the far left is the Power BI logo. The dark right-hand panel is a Power BI report — its header pairs the "Sales Analysis" title with the Power BI bars mark. The yellow circular button with a black chevron over the seam is a plain accent shape.
[Mood]
Dark charcoal with a bright yellow accent ring and a vivid bottom bar, against one pale spreadsheet panel. Crisp, split-screen, transformation story; the light-versus-dark halves read instantly at thumbnail scale.](https://files.posterlet.com/assets/generated/md/4333ppmfsg0y.webp)
![[Format]
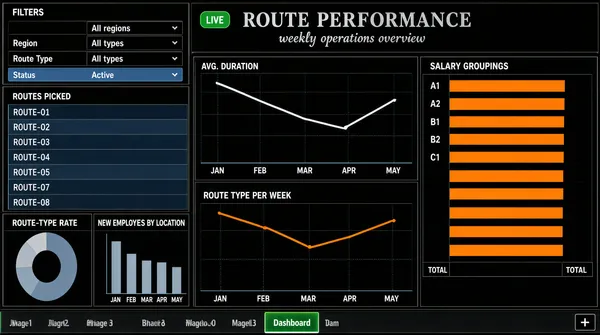
Landscape 16:9 gig cover, flat dark-themed dashboard-UI screenshot from a spreadsheet-style reporting tool. Dense, technical, thin gridlines. No watermark, no personal names.
[Layout]
Edge-to-edge screenshot, no device frame. A centred title line sits at the top with a subtitle just below, framed by a small green badge on the left. The canvas is a mosaic of dark panels with fine gridlines in a three-column arrangement: a top-left black filter panel with two rows of small labelled fields and a highlighted row; a left-middle panel with a tall scrollable roster of short name rows on alternating shading; below them a small donut chart panel and a small column chart panel side by side; the centre column holds two wide dark line-chart panels stacked, the upper one with a long descending-then-rising polyline over a five-month axis and the lower one with an orange polyline; the right column holds a single tall panel with a list of short code labels each carrying a long horizontal bar to its right, the bars in orange with a total marker. A thin workbook tab strip runs along the very bottom with one tab highlighted green and a small plus button.
[Subject]
None — UI only.
[Headline]
The centred title reads a two-word performance heading in a dark grey serif with a small script-style subtitle beneath it, and a small green rounded badge to the left of the title. Panel titles in small grey caps describe routes picked, average duration, durations per associate, route-type rate, route type per week, new employees by location and salary groupings. Small axis labels and month abbreviations run along the base of each chart. Render every string as neutral placeholder wording in the same positions and weights; no real company or product names.
[Badges]
None authentic — only tiny panel glyphs and the bottom tab strip; describe as generic small shapes.
[Mood]
Near-black panels with grey-blue gridlines, a muted blue-grey fill and one orange accent series. Serious, spreadsheet-power-user texture; the dense dark grid with orange bars reads distinctly at thumbnail size.](https://files.posterlet.com/assets/generated/md/4y8h9owuiq3l.webp)
![[Format]
Landscape 16:9 gig cover, bright hero-collage banner with device mockups and 3D props. Glossy, layered, promo energy. No watermark, no personal names.
[Layout]
A white-to-pale-grey field with a dark band across the very bottom edge. The upper-centre is dominated by a giant two-line headline with a ribbon band behind the second word. Below and around it a busy collage: a laptop mockup at the lower-left seen at an angle so its screen and keyboard deck both show, its screen filled with a Power BI dashboard; a cluster of 3D gold props at lower-centre — an ascending arrow sweeping up to the right above a stack of gold blocks and coin-like discs; and at the right two tilted dashboard cards stacked loosely, one showing ring charts, a world map and bars, the other a bar grid. A short column of four icon-plus-label rows sits at the mid-right. The bottom dark band holds one centred caption line.
[Subject]
None — typography, device mockups and 3D props only.
[Headline]
Top-left the Power BI logo — a small gold 3D ascending-bar glyph — with a short dark wordmark beside it. Centre headline: "POWER BI" in enormous heavy condensed dark blue-black uppercase on the top line, and "EXPERT" on the second line in the same face, sitting on a shallow gold ribbon banner that extends slightly past the word on both sides. Beneath, a two-part subtitle in white and gold uppercase reading "PROFESSIONAL DASHBOARDS & REPORTS". The four right-hand rows read "Custom Interactive Dashboards", "Data Visualization & Analysis", "KPI & Metrics Reports", "Fast Delivery & Support" in bold dark title case with gold icons. The bottom dark band carries a single uppercase call to action in white with the last word highlighted gold.
[Badges]
The top-left glyph is the Power BI logo — a gold ascending three-bar mark beside a short dark wordmark. The 3D gold props below (an ascending arrow, stacked blocks and coin-like discs) are decorative geometry rather than brand marks. The laptop screen and the two tilted cards show Power BI report visuals — ring charts, a world map, bars and KPI tiles.
[Mood]
Bright white with saturated gold 3D props and dark navy type, plus a black bottom band. Rich, commercial, high-production; the giant headline and the glowing gold props give a punchy thumbnail.](https://files.posterlet.com/assets/generated/md/d7re4d22ft9o.webp)
![[Format]
Landscape 16:9 gig cover, minimal centred brand-lockup on a textured white field. Quiet, print-like. No watermark, no personal names.
[Layout]
Almost the entire frame is a flat near-white surface carrying a very faint vertical fabric-like ribbing, brightest at the centre where a soft glow lifts the middle. Everything is centred on both axes in a tight vertical stack occupying the middle half of the height: a large graphic mark, then a bold wordmark line, then a smaller lighter line beneath it. There is no imagery, no device, no panel and no figure; the margins all round are large and empty, and a very faint vertical panel edge is barely visible at each side.
[Subject]
None — logo lockup only.
[Headline]
Directly under the mark, a bold dark near-black geometric sans in title case reads "Business Intelligence", centred, the widest text in the frame. Beneath it, a smaller and lighter grey sans line reads "IBM Cognos / Qlik Sense", keeping the slash construction and the same centring.
[Badges]
One large centred mark above the wordmark: a symmetrical composition of vertical bars of differing widths in dark indigo and a lighter violet, with two triangular wedges forming a downward and an upward arrow shape between them, plus a small solid triangle docked at the top. Everything sits inside an implied square footprint — geometric bars and triangles in an indigo-to-violet gradient.
[Mood]
Near-white with a soft indigo-violet gradient mark and dark type. Extremely restrained, corporate and quiet; at thumbnail size the mark's angular silhouette is the whole read.](https://files.posterlet.com/assets/generated/md/1t0kln2q5dbz.webp)
![[Format]
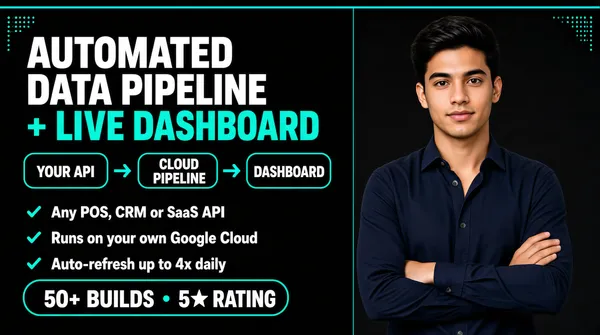
Landscape 16:9 gig cover, minimal dark banner with a process-chip row and a cut-out. Teal accent on near-black. No watermark, no personal names.
[Layout]
Full-bleed near-black charcoal ground with a thin bright teal bar across the very top edge and a small teal dotted corner motif at the top-left and top-right. Vertical split roughly 55/45. Left side, top to bottom: a two-line headline with the second line in teal; then a single horizontal row of three outlined rounded chips connected left-to-right by small teal arrow glyphs, forming a visible pipeline; then three stacked bullet rows each led by a small teal tick; and at the bottom a wide rounded outline pill containing a two-part caption. Right side: the person cut-out, cropped at about the hips by the bottom edge, occupying most of the right column.
[Subject]
A man in his early twenties, thick dark hair, plain dark navy button-up shirt with the collar open, arms folded across the chest, waist-up, calm confident expression at camera; placed at the right, cleanly cut out.
[Headline]
Top-left: "AUTOMATED DATA PIPELINE" in heavy white uppercase, then "+ LIVE DASHBOARD" in heavy teal uppercase on the second line at the same size. The three chips read "YOUR API", "CLOUD PIPELINE" and "DASHBOARD" as short uppercase phrases separated by arrows, forming the pipeline. Three bullet rows below in white sentence case with bold lead phrases reading "Any POS, CRM or SaaS API", "Runs on your own Google Cloud" and "Auto-refresh up to 4x daily". The bottom pill reads a build-count and a rating in bold white with a small separator dot.
[Badges]
None — the three chips are plain outlined rounded rectangles, the only adornment being the small teal arrow glyphs and tick marks.
[Mood]
Near-black with a single bright teal accent and white type. Clean, minimal, engineering-flavoured; the connected chip row gives an instantly readable process story at thumbnail size.](https://files.posterlet.com/assets/generated/md/mvg0wbehy0x7.webp)
![[Format]
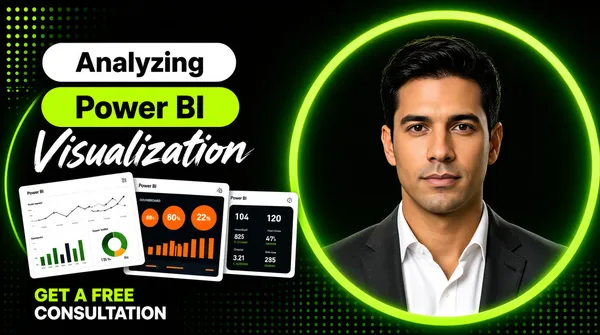
Landscape 16:9 gig cover, dark modern banner with a geometric ring and small screenshot thumbnails. Flat shapes plus a cut-out. No watermark, no personal names.
[Layout]
Full-bleed dark charcoal ground with a faint green dot-grid and a couple of thin neon-green circles bleeding off the left edge. Right side: one very large green ring outline, thick and slightly glowing, occupying most of the right half and cropped by the top and right edges; a man's cut-out stands inside it, his head and shoulders filling its opening, cropped at the chest by the bottom edge. Left side: a three-band typographic stack — a white rounded pill holding a word, a green rounded pill holding two words, and a white script line — with a row of three small tilted white dashboard screenshot cards floating just beneath, each rotated slightly and overlapping the next, and a two-line call-to-action caption at the bottom-left in mixed green and white. A small regular grid of dots sits at the very top-left corner.
[Subject]
A man in his thirties, dark hair, dark grey blazer over a white open-collar shirt, head-and-shoulders, neutral expression at camera; centred inside the big green ring on the right, cleanly cut out.
[Headline]
Left stack: the word "Analyzing" in bold dark sans on a white rounded pill; "Power BI" in bold dark sans on a green rounded pill directly beneath, the largest element; the word "Visualization" in a white brush-script face below that. The bottom-left caption runs in two lines: the first in bright green bold uppercase, the second in white bold uppercase, inviting a free consultation.
[Badges]
The cover carries no separate logo badge — the brand reference is the green rounded pill in the headline reading "Power BI". The three small floating cards are Power BI report screenshots: a light report page of line, bar and donut visuals, a dark tile with orange circles and bars, and a small dark KPI tile. The top-left dot grid is pure decoration.
[Mood]
Charcoal black with vivid green, white type and three small white cards. Moody, technical, modern; the big green ring and the pill stack give a strong, unusual thumbnail shape.](https://files.posterlet.com/assets/generated/md/qwzwh88whbyu.webp)
![[Format]
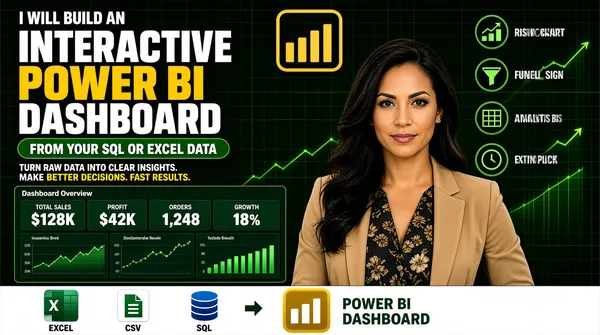
Landscape 16:9 gig cover, dense dark-marketplace banner with a cut-out and a dashboard panel. Green-and-gold accents on near-black. No watermark, no personal names.
[Layout]
Full-bleed near-black deep-green ground with faint green grid lines and trailing rising line-chart strokes in the upper right. The frame is densely packed, with four zones. Left half, top to bottom: a small white uppercase kicker; three enormous stacked headline lines; a green rounded pill; a two-part strapline; a wide dark-green Power BI dashboard panel with four KPI mini-cards across the top and three charts beneath; and finally a full-width white strip at the very bottom holding a row of small app tiles, a right arrow, a gold bar glyph and a two-line caption to its right. Right side: a short column of four icon-plus-label rows in the upper right, and beneath them the woman's cut-out filling the lower right. A large gold outlined Power BI logo mark sits at the top-centre.
[Subject]
A woman in her early thirties, long dark hair, wearing a tan blazer over a dark floral top, arms relaxed, waist-up, calm confident expression at camera; positioned on the right, cut out cleanly and layered in front of the ground.
[Headline]
Left stack: a small white uppercase kicker reading "I WILL BUILD AN"; then "INTERACTIVE" in huge heavy white uppercase, "POWER BI" in huge heavy yellow uppercase, and "DASHBOARD" again in huge heavy white uppercase. A green rounded pill carries white bold uppercase copy reading "FROM YOUR SQL OR EXCEL DATA". A strapline reads three short sentences in white with the final phrase highlighted in yellow. The dashboard panel title is a single grey word with four small KPI labels above bold figures. The bottom strip caption is green bold uppercase over two lines.
[Badges]
The bottom white strip holds small app tiles: the Microsoft Excel tile — a green rounded square with a white X glyph; a white CSV tile with a green document glyph; a blue SQL database cylinder as stacked discs; then a small right arrow and the Power BI logo — a gold rounded square with white ascending bars. The four right-hand rows use green circular line icons (a rising chart, a funnel, a grid, a clock). The top-centre mark is the Power BI logo — a thick gold outlined rounded frame holding gold ascending bars.
[Mood]
Near-black with deep green and bright gold accents. Dense, sales-forward, data-heavy; the trio of giant white-and-yellow headline lines still reads clearly at thumbnail size.](https://files.posterlet.com/assets/generated/md/qcyee23zw0q9.webp)
![[Format]
Landscape 16:9 gig cover, bold red banner with a photographic cut-out. Flat, high-saturation, punchy. No watermark, no personal names.
[Layout]
Full-bleed vivid red ground overlaid with a faint darker-ruled grid and one broad diagonal band sweeping from the lower-left to the upper-right, slightly darker than the field, so the frame splits into a lighter triangle and a shadowed one. Vertical split roughly 55/45. Left side: a four-line headline stack, then a column of four bullet lines each led by a small solid yellow dot, then a yellow rectangle button at the bottom, all left-aligned on a common margin. Right side: the person cut-out, running from the top edge to the bottom edge and cropped at the waist by the frame, overlapping the diagonal band.
[Subject]
A man in his thirties, dark hair, neat beard, black-framed glasses, navy suit jacket over a black shirt with a textured grey tie, arms folded, waist-up, confident smile at camera; placed on the right, cleanly cut out over the red ground.
[Headline]
Left stack: "PROFESSIONAL" in heavy white uppercase on the first line; "DATA ANALYTICS" in even larger heavy white uppercase sitting on a slightly larger red rounded bar that hugs the line; "SERVICES" in heavy yellow uppercase on the third line, centred against the other two. Four bullet rows beneath in white uppercase, each preceded by a small solid yellow dot. Bottom: a solid yellow rectangle with heavy dark uppercase "ORDER NOW".
[Badges]
None.
[Mood]
One vivid red field with white, yellow and a shadowed diagonal. Loud, urgent, high-contrast; the white-on-red headline plus the yellow button make it one of the most legible thumbnails in the set.](https://files.posterlet.com/assets/generated/md/o5dx6p1eiovv.webp)
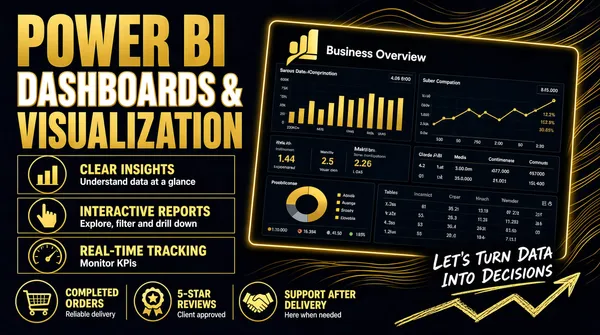
![[Format]
Landscape 16:9 gig cover, dark premium banner with a tilted Power BI dashboard mockup and glowing linework. Rich gold accents, high contrast. No watermark, no personal names.
[Layout]
Full-bleed near-black navy ground with a set of fine gold flowing wave lines sweeping behind the right-hand side, creating depth and motion. Vertical split roughly 45/55. The left side is a stacked typographic column: three headline lines of alternating weight and colour, then three outlined rows each pairing a circular outline icon on the left with a bold label and a smaller grey subtitle, and along the bottom edge three items each with a thin gold glyph above a short bold label, separated by hairline verticals. The right side is dominated by a large Power BI dashboard panel, its screen headed "Business Overview" and carrying the Power BI logo glyph, rotated a few degrees, with a bright gold hairline frame and a soft glow, its screen tiled with gold-on-dark Power BI charts. Handwritten-style script with a zigzag arrow sits along the bottom-right corner over the panel.
[Subject]
None — typographic and UI only.
[Headline]
Left stack: "POWER BI" enormous in heavy condensed uppercase gold; "DASHBOARDS &" beneath in heavy uppercase white with a thin outline treatment; "VISUALIZATION" again in heavy gold uppercase. Three list rows read "CLEAR INSIGHTS" with a subtitle about understanding data at a glance, "INTERACTIVE REPORTS" with a subtitle about exploring, filtering and drilling down, and "REAL-TIME TRACKING" with a subtitle about monitoring KPIs. Bottom labels read a completed-orders count, a five-star review count and a support-after-delivery promise, each with a tiny grey subline. The handwritten bottom-right script is a short two-line invitation with a sketched zigzag arrow beneath it.
[Badges]
The one brand mark on the cover is the Power BI logo — a gold ascending three-bar glyph — sitting at the top-left of the dashboard panel directly beside the "Business Overview" title. The list-row icons are simple gold outlined glyphs — a bar chart in a circle, a pointing hand, a speedometer; the bottom row uses a cart, a rosette and a handshake as trust icons.
[Mood]
Near-black navy with vivid gold throughout plus cool grey sublines. Premium, dark, editorial; the tilted glowing dashboard panel and the giant gold headline give an immediate thumbnail read.](https://files.posterlet.com/assets/generated/md/jsowu87uizz5.webp)
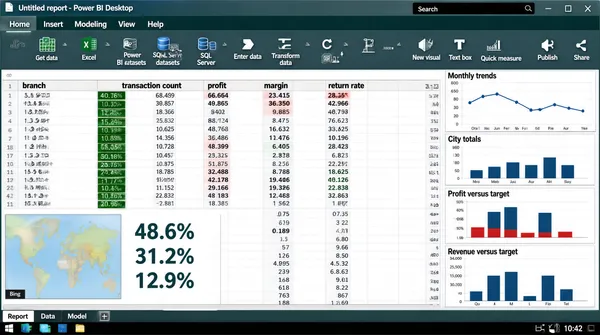
![[Format]
Landscape 16:9 gig cover, full desktop-application screenshot including the operating-system chrome. Dense, realistic software look. No watermark, no personal names.
[Layout]
A complete application window fills the frame: a title bar across the very top with a document name, a search field, an account chip and three window buttons at the right; beneath it a ribbon of tab labels over two rows of small icon-plus-caption groups in three tonal bands; then the working area, split into a wide data grid on the left two-thirds with a frozen header row of column names and many rows of small-print figures, and a right-hand column of narrow chart panels with a thin heading above each. At the very bottom a dark system taskbar runs edge to edge with a row of small square app icons at its left and a clock plus status glyphs at its right, and a page-tab strip sits just above it with several tab labels and a plus button.
[Subject]
None — interface only.
[Headline]
The title bar carries a document name (keep it as neutral placeholder wording) followed by the application descriptor "Power BI Desktop". The ribbon tab labels are short single words (Home, Insert, Modeling, View, Help) above command buttons labelled Get data, Excel, Power BI datasets, SQL Server, Enter data, Transform data, Refresh, New visual, Text box, Quick measure, Publish and Share. The grid's header row lists short column names such as branch, transaction count, profit, margin and return rate. The KPI headline block contains three large percentage figures stacked vertically. Small panel titles above the right-hand charts describe monthly trends, city totals, profit-versus-target and revenue-versus-target, and the small map panel at the bottom-left carries a "Bing" attribution line.
[Badges]
The ribbon icons are the tool's own glyphs, including the green Microsoft Excel mark (a white "X" over a grid), the Power BI datasets icon and the blue SQL Server cylinder. The Windows taskbar at the bottom carries a row of small square app icons at its left plus a clock and status glyphs; draw those as generic dark tiles.
[Mood]
Deep grey-teal ribbon and title chrome over a white grid, with dark-green and red conditional formatting in the cells. Serious, in-the-trenches tooling; the dense grid plus the OS taskbar make it read unmistakably as real software at thumbnail size.](https://files.posterlet.com/assets/generated/md/5nvmdw91oyin.webp)
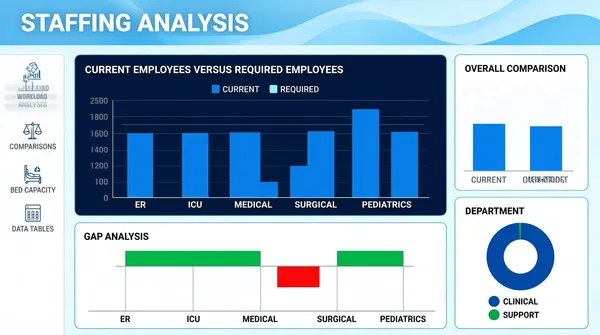
![[Format]
Landscape 16:9 gig cover, flat dashboard-UI screenshot on a light field. Thin outlined panels, blue accent, airy. No watermark, no personal names.
[Layout]
Edge-to-edge dashboard, no device frame. The top of the canvas carries a decorative header band: a pale blue ground with soft flowing wave lines and a deeper blue swell sweeping across it, with a page title at the upper-left. A slim white vertical rail runs down the left edge from below the header, holding an icon-and-label stack. The main canvas is a loose grid of white panels with thin light-blue outlines and modest rounding: a wide dark navy panel occupies the upper-centre with a grouped column chart inside it and a small legend above; a narrower white panel sits to its right with a second grouped column chart; and below, a broad white panel spans the left two-thirds with a diverging bar chart that has both upward bars and a couple of downward bars in contrasting colours, while at the bottom-right a white donut panel with a two-entry legend completes the grid.
[Subject]
None — UI only.
[Headline]
The page title at the top-left of the header band reads a two-word staffing-analysis heading in white bold. The left rail entries read short section names such as workload analysis, comparisons, bed capacity and data tables, in small grey caps beside tiny line icons. Panel titles in small grey caps read "Current Employees Versus Required Employees", "Overall Comparison", "Gap Analysis" and "Department". Axis labels and category names appear beneath each chart in tiny grey type.
[Badges]
None.
[Mood]
Pale blue-white canvas with a softly waved blue header, one dark navy chart panel and red/green diverging accents. Clean, clinical, capacity-planning feel; the dark centre panel gives the thumbnail its contrast anchor.](https://files.posterlet.com/assets/generated/md/ngvhkob2gake.webp)
![[Format]
Landscape 16:9 gig cover, warm editorial layout with a media-panel mockup and a photographic cut-out. Soft, calm, course-promo feel. No watermark, no personal names.
[Layout]
Flat warm beige ground, no texture. Three stacked zones on the left and one tall zone on the right. Top-left: a thin teal rule, then a small teal uppercase kicker line. Beneath it a two-line navy headline with a short teal underline stroke under the second line. Lower-left: a large dark navy rounded rectangle acting as a media card; inside it, offset to the upper-left, a smaller white browser-window mockup with three coloured dots at its top-left, a simple column chart, a large circular play button at its centre and a progress bar beneath; to the right of the white window, still inside the navy card, sit four white rounded rows stacked vertically, the upper three carrying a teal circular tick. Below the navy card, a teal rounded pill with white bold text and an arrow. Right side: the person cut-out, cropped at about the chest by the bottom edge and occupying roughly the right third.
[Subject]
A man in his early thirties, short dark hair, short beard, light blue button-up shirt with a collar, arms folded, chest-up, gentle neutral smile at camera; placed at the right, cleanly cut out.
[Headline]
Top-left kicker in small teal uppercase with wide tracking, naming a certification and a years-of-experience claim. Main headline in a heavy dark-navy geometric sans, title case, two lines reading "Data Analytics Training", with the second line underscored by a thick teal stroke that stops short of the line's end. The bottom pill reads "Book Your Session" in white bold title case followed by a long right arrow.
[Badges]
None — no product marks or logos. The four white rows inside the navy card are blank placeholders for feature list items.
[Mood]
Warm sand-beige with deep navy, teal and a single orange data bar. Calm, credible, education-marketplace tone; the navy media card with the white window is the thumbnail's structural hook.](https://files.posterlet.com/assets/generated/md/ps6ksb8w4tju.webp)
![[Format]
Landscape 16:9 gig cover, soft light UI-collage banner with a photographic cut-out. Gentle gradients, floating white cards, generous whitespace. No watermark, no personal names.
[Layout]
Very light blue-white ground with two or three soft out-of-focus blobs and a faint square dot-grid in the top-left corner. The frame is organised as three vertical zones without hard dividers. Left zone: a four-line headline stack, left-aligned, with a bottom-left white KPI card floating at the base. Centre zone: the person cut-out, standing slightly right of centre and cropped at the waist, overlapping both neighbours. Right zone: three small white KPI cards floating in a loose vertical stack along the right edge, each with a soft shadow and rounded corners — the top one with a metric and a small sparkline, the middle one with a donut and a short legend, the bottom one with a small world map and a colour ramp. A heavy blue underline bar sits beneath the headline's final word.
[Subject]
A man in his early thirties, dark hair with a short beard, crisp white button-up shirt with the sleeves rolled, arms folded, watch on his left wrist, waist-up, calm expression at camera; centred-right, cleanly cut out over the light background.
[Headline]
Left stack, four lines, all heavy uppercase geometric sans in a saturated cobalt blue: "DATA" on its own line, "VISUALIZATION &" beneath it slightly smaller, "DASHBOARD" larger again, then the word "EXPERT" in white uppercase with very wide letter-spacing sitting on a solid blue rounded bar that spans the column width. Card titles are in small grey uppercase caps with bold dark figures beside them.
[Badges]
None. The three floating cards contain only abstract chart graphics — a small polyline, a donut ring and a shaded world map.
[Mood]
Pale blue-white with a single saturated cobalt blue and clean white cards. Bright, trustworthy, portfolio-clean; the blue headline block plus the floating cards read instantly at thumbnail size.](https://files.posterlet.com/assets/generated/md/8iij9qpre8mi.webp)
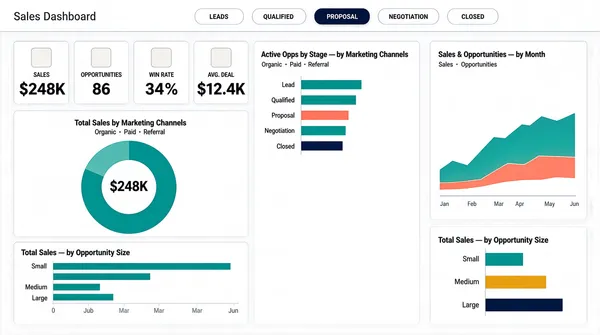
![[Format]
Landscape 16:9 gig cover, flat light dashboard-UI screenshot. Airy, minimal, teal-and-coral accent palette. No watermark, no personal names.
[Layout]
Edge-to-edge light dashboard, no device frame. A slim top strip holds a grey page title at the far left and a centred row of five small rounded pill tabs with one pill filled dark, under a hairline rule. Below, the canvas is a three-column mosaic with wide gutters: a left column carrying first a row of four small white stat tiles with pale icon squares, then beneath them a tall white donut panel with a large centre figure, then a wide horizontal bar panel; a middle column carrying a horizontal bar panel above empty space; and a right column holding a tall white area-chart panel at the top and a wide horizontal bar panel at the bottom. All panels are white with very faint borders over a pale grey-white field.
[Subject]
None — UI only.
[Headline]
The page title reads "Sales Dashboard" in grey. The stage pills read short stage names, one filled dark. The four stat tiles are labelled with a short uppercase metric word over a big dark value. Panel titles in small letterspaced grey caps read "Total Sales by Marketing Channels", "Active Opps by Stage — by Marketing Channels", "Sales & Opportunities — by Month" and "Total Sales — by Opportunity Size". Small legends and axis labels accompany each chart. Render all copy as neutral placeholder wording.
[Badges]
None.
[Mood]
White and pale grey with teal, coral, amber and navy data accents. Light, consultant-clean and orderly; the row of pills and the teal donut carry the thumbnail.](https://files.posterlet.com/assets/generated/md/iomsn4qv18up.webp)
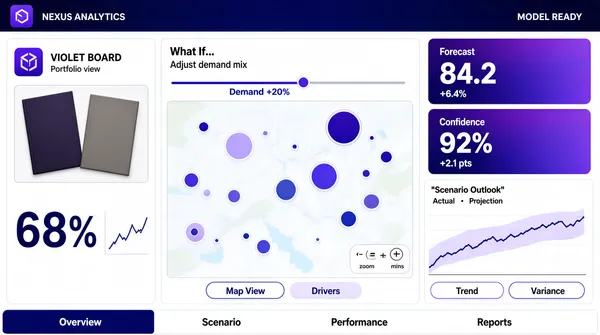
![[Format]
Landscape 16:9 gig cover, flat application-UI screenshot. Corporate software look with an indigo top ribbon and a white canvas. No watermark, no personal names.
[Layout]
Edge-to-edge application window, no device bezel. A deep indigo gradient ribbon runs across the top with a product label at the left, dashed separators, and a status line at the right. Below it the canvas is a three-column mosaic: a narrow left panel holds a product image block above a large percentage figure with a small column sparkline; a wide middle column holds a scenario control row with a slider above a large map panel with size-scaled circles and a small zoom control cluster, plus two pill tabs at the panel's foot; the right column holds two stacked gradient KPI cards at the top and a wide line-chart panel beneath with a shaded uncertainty band and a legend, plus two more pill tabs. A bottom tab strip runs the full width under the three columns.
[Subject]
None — UI only. Photographed product items (two boards) appear inside the left panel as product shots, not people.
[Headline]
The top ribbon carries a short product label at the left and a small status string at the right (render both as neutral placeholder text). The left panel title is a short product-style name with a small subtitle; a large percentage figure sits under the product shots. The middle panel label reads "What If..." in black with a small explanatory caption and a slider tick label. The right-hand KPI cards carry short labels with large indigo figures and small sub-values. A chart title sits in quotes over a two-entry legend. The bottom tabs read as short report names. Keep every string neutral; no real product or brand names.
[Badges]
The left panel's app icon is a small flat rounded-square in solid violet with a white glyph — describe as pure geometry and colour only. Ignore the tiny attribution strip and the map vendor line; do not render them.
[Mood]
Deep indigo-to-midnight-blue ribbon over a clean white canvas with violet accent cards. Enterprise-analytics polish; the dark ribbon anchors the thumbnail and the KPI cards give it colour.](https://files.posterlet.com/assets/generated/md/dft0lsi8t2z0.webp)
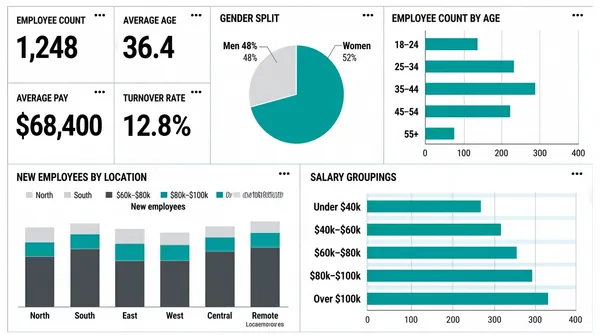
![[Format]
Landscape 16:9 gig cover, plain flat dashboard-UI screenshot. Minimal chrome, white field, thin grey rules, no shadows. No watermark, no personal names.
[Layout]
Edge-to-edge screenshot, no device frame, no top bar. The canvas is a simple two-row grid with even gutters and hairline separators. Upper row, left to right: a cluster of four small white stat tiles arranged two-by-two, each with a tiny title, a kebab dot pair at its top-right and one big dark number or price; then a tall white panel containing a single large two-slice pie chart with two leader lines; then a wide white panel holding a horizontal bar chart with a category list down its left edge and a baseline scale. Lower row: a wide white panel with a grouped stacked column chart of about six category groups plus a small legend and a location row; and a second wide white panel with a horizontal bar chart of five banded rows with long axis labels. Everything is separated by light grey rules with plenty of white space.
[Subject]
None — UI only.
[Headline]
All copy is small grey sentence-case tile titles and labels, except the four stat values, which are very large and light-weight dark figures. Each panel's chart title sits at its top-left in small grey caps, describing employee counts, ages, gender split, average pay, turnover rate, new employees by location and salary groupings. Render all wording as neutral placeholder copy in the same positions, sizes and weights.
[Badges]
None — the only marks are tiny three-dot kebab glyphs at the top-right corner of each panel.
[Mood]
Essentially white with dark-grey type and a single teal accent repeated across every chart. Quiet, plain, wireframe-clean; the big numbers in the four tiles are the only thing that reads at thumbnail scale.](https://files.posterlet.com/assets/generated/md/cg13hc2sthqt.webp)
![[Format]
Landscape 16:9 gig cover, ultra-minimal centred text card. Flat dark field, no imagery. No watermark, no personal names.
[Layout]
A flat very dark navy-teal field fills the frame with a barely-perceptible radial lift behind the centre. Everything is centred on the vertical and horizontal axes in a tight three-band stack occupying only the middle third of the height: a letterspaced headline line, a smaller subline, and a small square mark below it with a soft glow. There is no device frame, no chart and no figure — the composition is pure typography plus one small icon, with very large empty margins all round.
[Subject]
None — typographic and icon only.
[Headline]
Centre, line one: "POWER BI EXPERT" in heavy white uppercase with very wide letter-spacing, the largest element. Line two, directly beneath and much smaller: a light white sans line reading "Raw Data >> Dashboard" with monospaced spacing and double angle brackets between the phrases.
[Badges]
Below the text, a small white rounded-square tile carrying the Power BI logo — three ascending rounded bars in graduated amber-to-gold, the shortest at the left; the tile has a soft outer glow. Draw the brand mark itself, with no lettering.
[Mood]
Near-black navy-teal with white type and one warm gold glyph. Extremely restrained, quiet and premium; the single gold mark and the wide-tracked white headline do all the thumbnail work.](https://files.posterlet.com/assets/generated/md/ozxgycjozmr4.webp)
![[Format]
Landscape 16:9 gig cover, minimal flat icon-and-type layout. Two-colour restraint, clean vector shapes. No watermark, no personal names.
[Layout]
A single flat deep-navy field with a very subtle vertical gradient. Two-column split roughly 50/50 on a common centre line. Left column: a centred-left text stack of three lines, optically aligned to the vertical middle of the frame. Right column: two stacked shapes — above, the Power BI logo, a large bright-yellow rounded square with a small tail at its lower-left so it reads as a speech bubble, holding a dark three-bar ascending chart glyph; below and overlapping it, a large dark navy panel with a soft border containing a small white line chart with dots, a small pie glyph and three short horizontal rule lines standing in for text. The yellow shape is much the largest element in the frame.
[Subject]
None — typographic and icon only.
[Headline]
Left column, three lines in a clean geometric sans: "BUSINESS" and "INTELLIGENCE" in heavy white uppercase on two lines with tight leading, forming the dominant text; then a smaller, lighter white title-case line reading "with Power BI".
[Badges]
The large yellow rounded-square bubble is the Power BI logo: three dark rounded bars of increasing height, ascending left to right. The dark panel below holds a simple white polyline with circular nodes, a small quartered pie circle, and three pale rule lines. Draw the Power BI mark as the real logo rather than an anonymous shape.
[Mood]
Only deep navy and vivid yellow, plus white linework. Very sparse and poster-like; the oversized yellow bubble against navy is the entire thumbnail read.](https://files.posterlet.com/assets/generated/md/yw9khdwa7tg5.webp)
![[Format]
Landscape 16:9 gig cover, playful flat banner with a photographic cut-out. Bright, glossy, rounded shapes. No watermark, no personal names.
[Layout]
Full-bleed diagonal gradient from teal-green at the top-left to warm yellow at the bottom-right, overlaid with a faint hexagon honeycomb pattern and a couple of cropped circular rings. Vertical split roughly 55/45. Left side, stacked: the Power BI logo, a small 3D gold bar glyph, at the top-left, then four headline lines of markedly different treatments, then a chevron-accented strapline, a column of four bullet rows, and a solid pill button at the bottom; the Microsoft Excel icon (a small green tile with a white cross over a spreadsheet grid) and a gold ascending-bar growth icon float at the left edge. Right side: the person cut-out, filling the right half from about the shoulders down to the bottom edge, overlapping the gradient.
[Subject]
A man in his mid-twenties, dark hair, round metal glasses, light blue button-up shirt, arms relaxed, waist-up, smiling at camera; placed on the right, cleanly cut out with a soft edge glow.
[Headline]
Four-line headline stack, top to bottom: the word "Professional" in a gold serif or script, title case; "DATA" in heavy white uppercase on a dark-teal rounded pill; "ANALYTICS" in heavy black uppercase on a bright yellow rounded pill, this being the largest element; the word "Services" in a white script face. Underneath, four bullet rows each beginning with a yellow circular tick on a dark pill, followed by white bold sentence-case copy. Bottom: a dark-teal pill with white uppercase "ORDER NOW!" preceded by a row of white chevrons.
[Badges]
Two small square app tiles at the left margin: the Power BI logo (a gold rounded square with white ascending bars) and the Microsoft Excel icon (a dark-green rounded square with a white cross glyph beside a spreadsheet grid). Also a small gold ascending-bar growth icon and a thin white arrow. Render the Excel and Power BI marks as the real logos.
[Mood]
Teal-green to sunny yellow gradient with gold, white and black type. Cheerful, friendly, high-clarity; the giant yellow "ANALYTICS" pill is the thumbnail's focal point.](https://files.posterlet.com/assets/generated/md/2ikoj1r654y3.webp)
![[Format]
Landscape 16:9 gig cover, dense dark-marketplace banner with a device mockup and a cut-out. High contrast, layered, promo energy. No watermark, no personal names.
[Layout]
Full-bleed dark navy-black background with a faint radial light behind the subject. The frame is packed nearly edge to edge. Left half, top to bottom: a small gold uppercase kicker, a two-line giant headline, an outlined white pill strapline, a row of five dark square tiles with icons and labels, then a horizontal group with a red target icon and two lines of copy beside four green check rows; the bottom edge carries three icon-plus-label items separated by thin dividers. Right half: a large desktop monitor mockup tilted slightly, its screen filled with a light Power BI dashboard; a man's cut-out stands in front of it, overlapping the monitor's lower-left, cropped at the waist by the bottom edge. A tall green ribbon badge sits top-centre straddling the two halves. A white Microsoft certification badge is pasted over the lower-right, and a bright yellow action bar with an arrow glyph occupies the bottom-right corner.
[Subject]
A man in his early thirties, dark hair and short beard, navy suit, white shirt and dark-blue tie, chest-up, looking directly at camera; positioned centre-right, cut out and layered over the monitor and the yellow bar.
[Headline]
Left stack: a small gold uppercase word; then "POWER BI" enormous in heavy white uppercase beside the gold 3D Power BI bar logo; then "DASHBOARD" in even larger gold uppercase with a white stroke. A white pill strapline reads two short slogans joined by a dot. Tile labels read "DYNAMIC DASHBOARDS", "DAX EXPERT", "POWER QUERY", "SQL EXPERT", "PERFORMANCE OPTIMIZATION". Beside the target icon a line reads "100% CLIENT SATISFACTION". Four green check rows list short promises. The bottom row reads "FAST DELIVERY", "UNLIMITED REVISIONS", "DEDICATED SUPPORT". The yellow bottom-right bar reads "ORDER NOW" in heavy black uppercase with a small kicker line beneath.
[Badges]
The green ribbon badge reads "7+ YEARS EXPERIENCE". The lower-right badge is the Microsoft certification badge: the four-colour Microsoft logo over the "Microsoft" wordmark and a bold "CERTIFIED POWER BI DATA ANALYST ASSOCIATE" line with a small "PL-300" shield. The five tiles below the headline use flat coloured line icons.
[Mood]
Near-black navy with white, gold and one green ribbon plus a yellow action bar. Dense, aggressive, everything-at-once marketplace styling; the giant gold word and the yellow bar guarantee thumbnail legibility.](https://files.posterlet.com/assets/generated/md/a9x9lu9a9dzr.webp)