Generate
Create images with AI
Tech Sales Dashboard Report
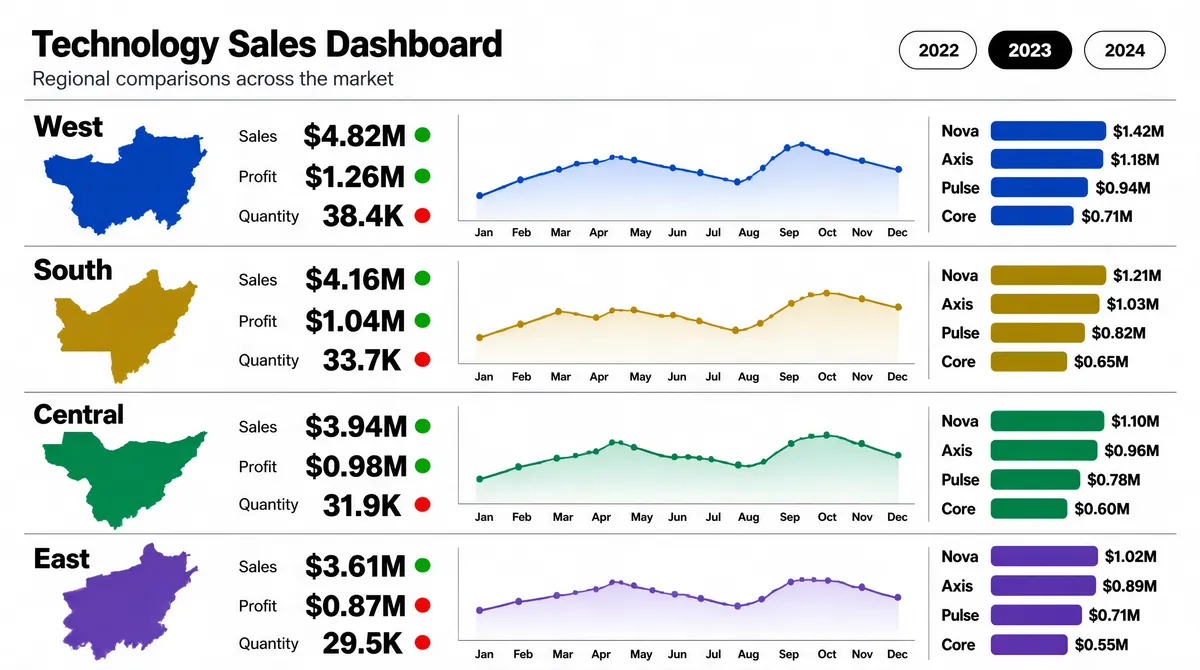
[Format] Landscape 16:9 gig cover, flat analytical reporting layout on white. Systematic, spreadsheet-clean, colour-coded rows. No watermark, no personal names. [Layout] A plain white field with no chrome. A title block sits at the top-left with a two-line heading and a small legend line beneath it. At the top-right, a cluster of three rounded pill tabs sits in a horizontal row. Below, the body is a vertical stack of four identical full-width rows, tightly aligned to the same internal grid so they read as a repeating unit; a hairline rule separates each. Every row contains, in order from the left: a region label with a small coloured map silhouette beneath it and a row of three small delta chips at its base; a block of three stacked figures each with a bold value over a light label and a delta chip; a wide line chart with a pale gradient fill and month labels along the base; and at the far right a short vertical stack of four category rows, each a name with a bold value and a horizontal bar in the row's accent colour. The four rows step through four different accent colours in sequence. [Subject] None — data layout only. [Headline] Top-left heading in bold near-black sans: "Technology Sales Dashboard", with a smaller grey subtitle line beneath it describing regional comparisons across a market. Region labels down the left edge of each row read "West", "South", "Central" and "East" in bold. Within each row the metric labels read "Sales", "Profit" and "Quantity" in small grey caps over large bold dark values, each followed by a tiny green or red delta chip. The right-hand category lists use short product-style names with bold figures beside coloured bars. The three top-right pill tabs hold three short year labels, the middle one filled solid black with white text. [Badges] None — the only graphics are the small abstract map silhouettes in each row's accent colour and the delta chips. [Mood] White with four distinct accent families — cobalt blue, olive gold, emerald green and violet — repeating down the stack. Ordered, comparative, report-clean; the four colour bands give the thumbnail an instantly readable rhythm.
Tags
More Images