About this collection
An infographic does one job: it replaces a paragraph nobody finishes with a shape anybody understands in two seconds. This collection gathers layouts built to do exactly that — process chains, comparison splits, timelines, stat callouts, and data charts — across business, education, marketing, and technical subjects.
One practical difference from a poster collection: the formats here are mixed on purpose. There are wide landscape layouts for slide decks and article headers, squares for social feeds, and tall portrait layouts for print and story placements. Choose by looking at the individual image rather than assuming a shape.
Choosing the shape before the chart
The most common mistake is picking a chart type because it looks impressive, then hunting for data to justify it. Work the other way round:
- Comparing a few items → horizontal bars. Ranked, readable, and no legend required.
- Change over time → a line chart, or a timeline when the milestones matter more than the exact values.
- Parts of a whole → a stacked bar or a percentage block. Pie charts stop working past about three slices.
- A process or sequence → numbered steps with connecting arrows. That is a diagram, not a chart.
- One number that carries the whole point → a stat callout. A single large figure with one line of context beats a chart that buries it.
Making it readable at a glance
- One message per graphic. If the takeaway cannot be stated in one sentence, the layout is carrying too much.
- Label directly. Put labels beside the marks instead of in a legend; a legend costs the reader an extra lookup.
- Five to seven data points, maximum. Beyond that, the graphic is a table with decoration.
- Let the whitespace breathe. Crowding every corner loses a reader faster than a sparse layout loses information.
Common questions
Are the numbers in these graphics real data?
No, and this matters before you publish one. The figures inside a generated chart are illustrative placeholders chosen to make the layout look right — they are not measured from any source. Replace them with your own verified numbers before anything goes public, and be especially careful with financial, medical, or performance claims.
What size are these infographics?
The collection is genuinely mixed — wide landscape, square and tall portrait layouts all appear. Check the individual image before designing around it, because a portrait layout will fight a wide banner slot.
Can I edit the data or the text after generating?
Not in place. The text and figures are rendered into the image, so there is no dataset or text layer underneath to edit. Download the file and open it in your own editor, or use the "Use as Template" option to regenerate it from a different brief.
What is the difference between a chart and a diagram?
A chart encodes numbers — position, length, or area mapped to values. A diagram encodes structure — steps, relationships, hierarchy. Most infographics mix the two, which works fine provided the numbers stay accurate and the structure stays simple enough to follow without instructions.
How much information should one infographic carry?
One takeaway and five to seven supporting data points. If you need more than that, split it into a series: three clear graphics actually get read, whereas one dense graphic gets scrolled past.

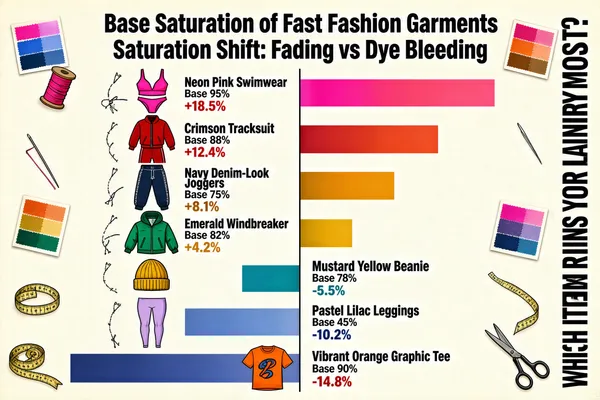
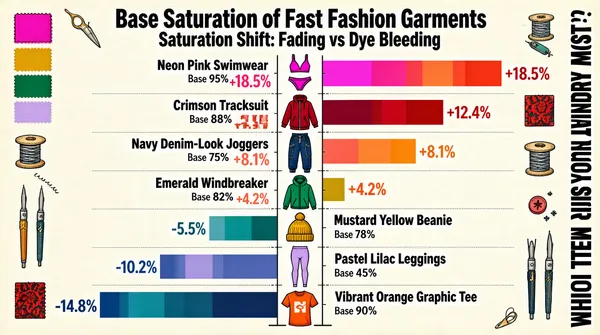
![An infographic titled 'Base Saturation of Fast Fashion Garments' and 'Saturation Shift: Fading vs Dye Bleeding' at the top. The chart features a central vertical line with various garment icons: Neon Pink Swimwear, Crimson Tracksuit, Navy Denim-Look Joggers, Emerald Windbreaker, Mustard Yellow Beanie, Pastel Lilac Leggings, and Vibrant Orange Graphic Tee. For each item, the 'Base' saturation percentage is listed, and a color-segmented horizontal bar shows the saturation shift. Bars extending to the right in warm tones indicate positive 'dye bleeding' shifts (+18.5%, +12.4%, +8.1%, +4.2%), while bars extending to the left in cool tones indicate negative 'fading' shifts (-5.5%, -10.2%, -14.8%). The text 'WHICH ITEM RUINS YOUR LAUNDRY MOST?' is displayed vertically on the right. The background is cream-colored, decorated with color swatches and sewing tools. The given data is : [{"base_saturation": "95%", "garment_name": "Neon Pink Swimwear", "saturation_shift": "+18.5%"}, {"base_saturation": "88%", "garment_name": "Crimson Tracksuit", "saturation_shift": "+12.4%"}, {"base_saturation": "75%", "garment_name": "Navy Denim-Look Joggers", "saturation_shift": "+8.1%"}, {"base_saturation": "82%", "garment_name": "Emerald Windbreaker", "saturation_shift": "+4.2%"}, {"base_saturation": "78%", "garment_name": "Mustard Yellow Beanie", "saturation_shift": "-5.5%"}, {"base_saturation": "45%", "garment_name": "Pastel Lilac Leggings", "saturation_shift": "-10.2%"}, {"base_saturation": "90%", "garment_name": "Vibrant Orange Graphic Tee", "saturation_shift": "-14.8%"}]](https://files.posterlet.com/assets/generated/md/nwxeeohk5c5n.webp)

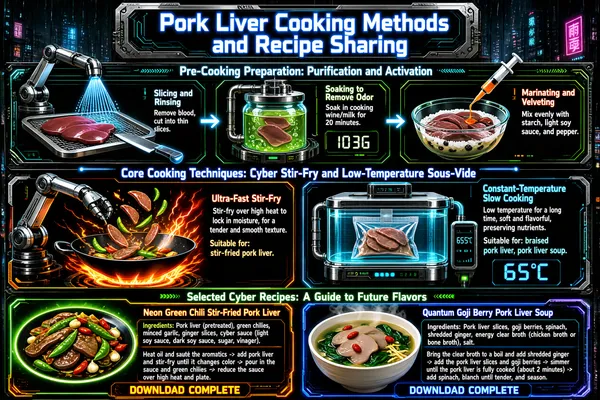
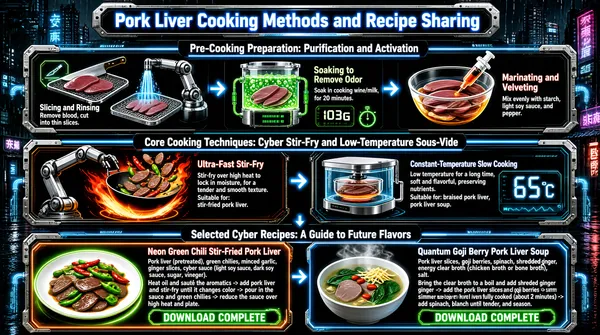
![This infographic presents "Pork Liver Cooking Methods and Recipe Sharing" in a cyberpunk sci-fi style. It uses an overall dark background paired with high-contrast glowing elements in neon blue, orange, and green, creating the visual atmosphere of a futuristic technology kitchen. The image is filled with technological elements such as circuit-board textures, robotic arms, transparent containers, and data display screens, reinforcing the "cyber" theme. The information structure is clear, divided into three main parts: the upper part is "Pre-Cooking Preparation: Purification and Activation," the middle part is "Core Cooking Techniques: Cyber Stir-Fry and Low-Temperature Sous-Vide," and the lower part is "Selected Cyber Recipes: A Guide to Future Flavors." **Title and layout:** The main title "Pork Liver Cooking Methods and Recipe Sharing" is located at the top center, displayed in bold blue neon lettering on a rectangular panel with a metallic border. Below it, three horizontal glowing conduits divide the content into three major parts, each with its own subtitle and corresponding icons. --- **Part One: Pre-Cooking Preparation (top)** This part introduces the pretreatment steps for pork liver, divided into three steps arranged from left to right: 1. **Slicing and Rinsing** - Icons: on the left, a glowing cutting-tool icon; on the right, a scene of a robotic arm spraying water to rinse the pork liver. - Text description: "Remove blood, cut into thin slices." - Visual elements: two pieces of raw pork liver placed on a metal mesh tray, with a blue light beam above simulating the rinsing process. 2. **Soaking to Remove Odor** - Icons: a transparent glass jar with green bubbling liquid inside, and a digital display at the bottom showing "103G" and a timer icon. - Text description: "Soak in cooking wine/milk for 20 minutes." - Visual elements: the jar is connected to pipelines, implying an automated processing flow. 3. **Marinating and Velveting** - Icons: a glass bowl containing pork liver slices, with a syringe injecting orange liquid. - Text description: "Mix evenly with starch, light soy sauce, and pepper." - Visual elements: the ingredients in the bowl are illuminated by light, highlighting the "velveting" action. --- **Part Two: Core Cooking Techniques (middle)** This part presents two core cooking methods in a left-right symmetrical layout: - **[Technique One: Ultra-Fast Stir-Fry]** - Icons: a robotic arm holding a wok stir-frying over a flame, with red and green chili peppers and pork liver splashing in the pan, accompanied by lightning effects. - Text description: "Stir-fry over high heat to lock in moisture, for a tender and smooth texture. Suitable for: stir-fried pork liver." - Background: orange-red flames and electric arc effects, emphasizing high heat and speed. - **[Technique Two: Constant-Temperature Slow Cooking]** - Icons: a transparent sous-vide machine with a heating plate inside and a digital screen on the right showing "65°C." - Text description: "Low temperature for a long time, soft and flavorful, preserving nutrients. Suitable for: braised pork liver, pork liver soup." - Background: cool-toned blue light, reflecting precise temperature control. --- **Part Three: Selected Cyber Recipes (bottom)** This part provides two specific recipes, side by side, distinguished by orange and blue borders respectively: - **Recipe A: Neon Green Chili Stir-Fried Pork Liver** - Icons: an image of the finished dish, with pork liver slices mixed with green and red chilies on the plate and a neon halo around the edges. - Ingredient list: "Pork liver (pretreated), green chilies, minced garlic, ginger slices, cyber sauce (light soy sauce, dark soy sauce, sugar, vinegar)." - Process description: "Heat oil and sauté the aromatics -> add pork liver and stir-fry until it changes color -> pour in the sauce and green chilies -> reduce the sauce over high heat and plate." - Bottom label: "DOWNLOAD COMPLETE" - **Recipe B: Quantum Goji Berry Pork Liver Soup** - Icons: a steaming bowl of soup containing pork liver slices, goji berries, and spinach, with steam floating on the surface. - Ingredient list: "Pork liver slices, goji berries, spinach, shredded ginger, energy clear broth (chicken broth or bone broth), salt." - Process description: "Bring the clear broth to a boil and add shredded ginger -> add the pork liver slices and goji berries -> simmer until the pork liver is fully cooked (about 2 minutes) -> add spinach, blanch until tender, and season." - Bottom label: "DOWNLOAD COMPLETE" --- **Overall visual and design details:** - The background is a rainy-night urban street scene, with neon signs and tall building silhouettes visible in the distance, enhancing the cyberpunk atmosphere. - All text uses sans-serif fonts, paired with glowing borders or shadows to improve readability. - The data encoding methods include clearly marked values such as time (20 minutes), temperature (65°C), and weight (103G). - The action flow is clearly expressed through arrows, icons, and step-by-step text, making it easy for users to understand the order of operations. - The overall design blends modern culinary science with futuristic aesthetics, giving the cooking methods for traditional ingredients a high-tech feel. This infographic not only conveys practical cooking knowledge, but also builds an immersive "future kitchen" experience through visual storytelling.](https://files.posterlet.com/assets/generated/md/gnpufai17rgx.webp)


![An infographic titled 'Base Saturation of Fast Fashion Garments' and 'Saturation Shift: Fading vs Dye Bleeding' at the top. The chart features a central vertical line with various garment icons: Neon Pink Swimwear, Crimson Tracksuit, Navy Denim-Look Joggers, Emerald Windbreaker, Mustard Yellow Beanie, Pastel Lilac Leggings, and Vibrant Orange Graphic Tee. For each item, the 'Base' saturation percentage is listed, and a color-segmented horizontal bar shows the saturation shift. Bars extending to the right in warm tones indicate positive 'dye bleeding' shifts (+18.5%, +12.4%, +8.1%, +4.2%), while bars extending to the left in cool tones indicate negative 'fading' shifts (-5.5%, -10.2%, -14.8%). The text 'WHICH ITEM RUINS YOUR LAUNDRY MOST?' is displayed vertically on the right. The background is cream-colored, decorated with color swatches and sewing tools. The given data is : [{"base_saturation": "95%", "garment_name": "Neon Pink Swimwear", "saturation_shift": "+18.5%"}, {"base_saturation": "88%", "garment_name": "Crimson Tracksuit", "saturation_shift": "+12.4%"}, {"base_saturation": "75%", "garment_name": "Navy Denim-Look Joggers", "saturation_shift": "+8.1%"}, {"base_saturation": "82%", "garment_name": "Emerald Windbreaker", "saturation_shift": "+4.2%"}, {"base_saturation": "78%", "garment_name": "Mustard Yellow Beanie", "saturation_shift": "-5.5%"}, {"base_saturation": "45%", "garment_name": "Pastel Lilac Leggings", "saturation_shift": "-10.2%"}, {"base_saturation": "90%", "garment_name": "Vibrant Orange Graphic Tee", "saturation_shift": "-14.8%"}]](https://files.posterlet.com/assets/generated/md/gnz1up7y8b2p.webp)

![This infographic presents "Pork Liver Cooking Methods and Recipe Sharing" in a cyberpunk sci-fi style. It uses an overall dark background paired with high-contrast glowing elements in neon blue, orange, and green, creating the visual atmosphere of a futuristic technology kitchen. The image is filled with technological elements such as circuit-board textures, robotic arms, transparent containers, and data display screens, reinforcing the "cyber" theme. The information structure is clear, divided into three main parts: the upper part is "Pre-Cooking Preparation: Purification and Activation," the middle part is "Core Cooking Techniques: Cyber Stir-Fry and Low-Temperature Sous-Vide," and the lower part is "Selected Cyber Recipes: A Guide to Future Flavors." **Title and layout:** The main title "Pork Liver Cooking Methods and Recipe Sharing" is located at the top center, displayed in bold blue neon lettering on a rectangular panel with a metallic border. Below it, three horizontal glowing conduits divide the content into three major parts, each with its own subtitle and corresponding icons. --- **Part One: Pre-Cooking Preparation (top)** This part introduces the pretreatment steps for pork liver, divided into three steps arranged from left to right: 1. **Slicing and Rinsing** - Icons: on the left, a glowing cutting-tool icon; on the right, a scene of a robotic arm spraying water to rinse the pork liver. - Text description: "Remove blood, cut into thin slices." - Visual elements: two pieces of raw pork liver placed on a metal mesh tray, with a blue light beam above simulating the rinsing process. 2. **Soaking to Remove Odor** - Icons: a transparent glass jar with green bubbling liquid inside, and a digital display at the bottom showing "103G" and a timer icon. - Text description: "Soak in cooking wine/milk for 20 minutes." - Visual elements: the jar is connected to pipelines, implying an automated processing flow. 3. **Marinating and Velveting** - Icons: a glass bowl containing pork liver slices, with a syringe injecting orange liquid. - Text description: "Mix evenly with starch, light soy sauce, and pepper." - Visual elements: the ingredients in the bowl are illuminated by light, highlighting the "velveting" action. --- **Part Two: Core Cooking Techniques (middle)** This part presents two core cooking methods in a left-right symmetrical layout: - **[Technique One: Ultra-Fast Stir-Fry]** - Icons: a robotic arm holding a wok stir-frying over a flame, with red and green chili peppers and pork liver splashing in the pan, accompanied by lightning effects. - Text description: "Stir-fry over high heat to lock in moisture, for a tender and smooth texture. Suitable for: stir-fried pork liver." - Background: orange-red flames and electric arc effects, emphasizing high heat and speed. - **[Technique Two: Constant-Temperature Slow Cooking]** - Icons: a transparent sous-vide machine with a heating plate inside and a digital screen on the right showing "65°C." - Text description: "Low temperature for a long time, soft and flavorful, preserving nutrients. Suitable for: braised pork liver, pork liver soup." - Background: cool-toned blue light, reflecting precise temperature control. --- **Part Three: Selected Cyber Recipes (bottom)** This part provides two specific recipes, side by side, distinguished by orange and blue borders respectively: - **Recipe A: Neon Green Chili Stir-Fried Pork Liver** - Icons: an image of the finished dish, with pork liver slices mixed with green and red chilies on the plate and a neon halo around the edges. - Ingredient list: "Pork liver (pretreated), green chilies, minced garlic, ginger slices, cyber sauce (light soy sauce, dark soy sauce, sugar, vinegar)." - Process description: "Heat oil and sauté the aromatics -> add pork liver and stir-fry until it changes color -> pour in the sauce and green chilies -> reduce the sauce over high heat and plate." - Bottom label: "DOWNLOAD COMPLETE" - **Recipe B: Quantum Goji Berry Pork Liver Soup** - Icons: a steaming bowl of soup containing pork liver slices, goji berries, and spinach, with steam floating on the surface. - Ingredient list: "Pork liver slices, goji berries, spinach, shredded ginger, energy clear broth (chicken broth or bone broth), salt." - Process description: "Bring the clear broth to a boil and add shredded ginger -> add the pork liver slices and goji berries -> simmer until the pork liver is fully cooked (about 2 minutes) -> add spinach, blanch until tender, and season." - Bottom label: "DOWNLOAD COMPLETE" --- **Overall visual and design details:** - The background is a rainy-night urban street scene, with neon signs and tall building silhouettes visible in the distance, enhancing the cyberpunk atmosphere. - All text uses sans-serif fonts, paired with glowing borders or shadows to improve readability. - The data encoding methods include clearly marked values such as time (20 minutes), temperature (65°C), and weight (103G). - The action flow is clearly expressed through arrows, icons, and step-by-step text, making it easy for users to understand the order of operations. - The overall design blends modern culinary science with futuristic aesthetics, giving the cooking methods for traditional ingredients a high-tech feel. This infographic not only conveys practical cooking knowledge, but also builds an immersive "future kitchen" experience through visual storytelling.](https://files.posterlet.com/assets/generated/md/83l4jw586e47.webp)


