Generate
Create images with AI
The infographic titled "College Entrance Pathway Reforce Com
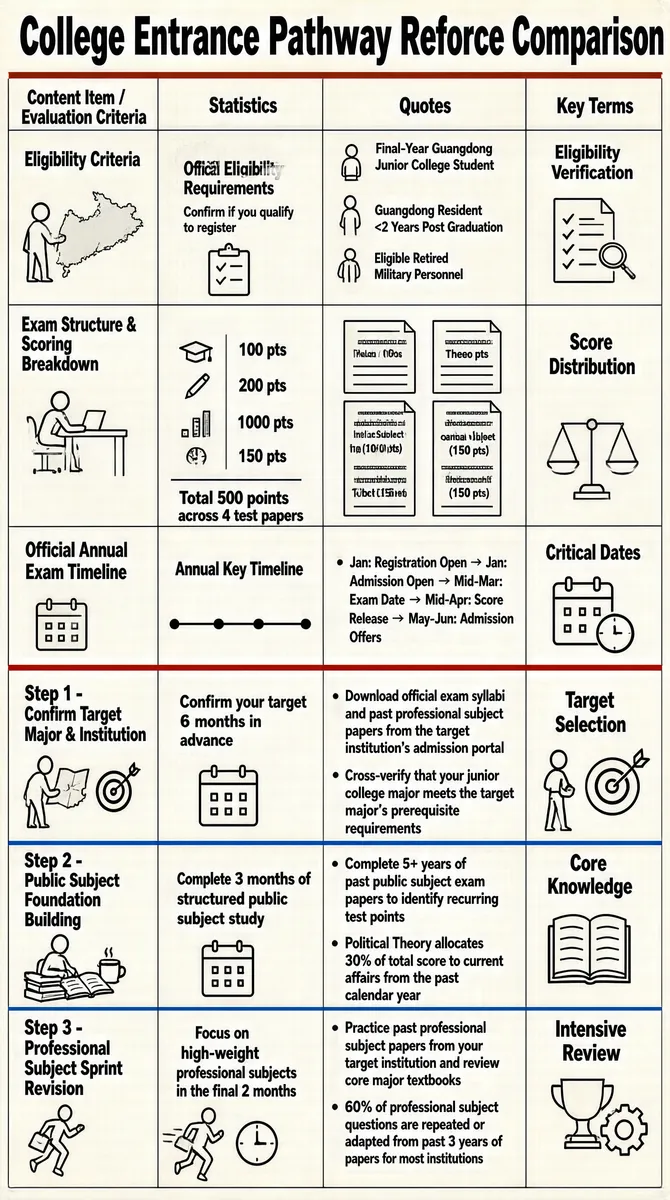
The infographic titled "College Entrance Pathway Reforce Comparison" presents a structured comparison of key aspects for prospective students in Guangdong, China, aiming to enter college through a specialized entrance examination. The layout is organized as a multi-column table with four main columns: "Content Item / Evaluation Criteria", "Statistics", "Quotes", and "Key Terms". Each row corresponds to a distinct evaluation criterion or step in the preparation process, with visual icons, text, and data points enhancing clarity. The infographic uses a clean, minimalist design with black line art icons on a light beige background. Text is primarily in bold sans-serif font, with headings emphasized for readability. Data is encoded using icons (e.g., graduation cap, calendar, books, target, rocket) to visually represent concepts, while numerical values are explicitly labeled for precision. The first row addresses **Eligibility Criteria**: - In the "Statistics" column, it features an icon of a person checking a map of Guangdong with the text: "Official Eligibility Requirements Confirm if you qualify to register". - The "Quotes" column lists three eligible groups with corresponding icons: "Final-Year Guangdong Junior College Student", "Guangdong Resident <2 Years Post Graduation", and "Eligible Retired Military Personnel". - The "Key Terms" column shows a magnifying glass over a document with the label: "Eligibility Verification". The second row covers **Exam Structure & Scoring Breakdown**: - "Statistics" displays icons representing different test types and scores: 100 pts (graduation cap), 200 pts (person at desk), 1000 pts (document with pen), 150 pts (document with pen). Below: "Total 500 points across 4 test papers". - "Quotes" lists four subject components in document-shaped boxes: "Political Theory (100 pts)", "Major-Aligned Public Subject (100 pts)", "Professional Subject 1 (150 pts)", "Professional Subject 2 (150 pts)". - "Key Terms" includes a balance scale icon with "Score Distribution". The third row details the **Official Annual Exam Timeline**: - "Statistics" contains a horizontal timeline with icons of a calendar and clock, labeled "Annual Key Timeline". - "Quotes" provides a detailed timeline: Jan: Registration Open → Jan: Admission Open → Mid-Mar: Exam Date → Mid-Apr: Score Release → May-Jun: Admission Offers. - "Key Terms" shows a calendar and clock with "Critical Dates". The next three rows outline a three-step preparation strategy: **Step 1 - Confirm Target Major & Institution**: - "Statistics": Icon of a person holding a map with a target, text: "Confirm your target 6 months in advance". - "Quotes": Two bullet points: "Download official exam syllabi and past professional subject papers from the target institution’s admission portal" and "Cross-verify that your junior college major meets the target major’s prerequisite requirements". - "Key Terms": Clock and books with "Target Selection". **Step 2 - Public Subject Foundation Building**: - "Statistics": Icon of a person studying with books and a coffee cup, text: "Complete 3 months of structured public subject study". - "Quotes": Two bullet points: "Complete 5+ years of past public subject exam papers to identify recurring test points" and "Political Theory allocates 30% of total score to current affairs from the past calendar year". - "Key Terms": Box with lightbulb and "Core Knowledge". **Step 3 - Professional Subject Sprint Revision**: - "Statistics": Icon of a running person with a book and clock, text: "Focus on high-weight professional subjects in the final 2 months". - "Quotes": Two bullet points: "Practice past professional subject papers from your target institution and review core major textbooks" and "60% of professional subject questions are repeated or adapted from past 3 years of papers for most institutions". - "Key Terms": Trophy and gears with "Intensive Review". Red horizontal lines separate the first three criteria from the three-step strategy, while a blue line separates Step 1 from Steps 2 and 3, visually grouping related content. All textual information is preserved exactly as presented, including spelling variations like "Oficial" (likely intended as "Official"). The infographic serves as a strategic roadmap combining official requirements, scoring details, timelines, and actionable preparation steps for candidates.
More Images