Generate
Create images with AI
Expert Financial Modeling in Excel
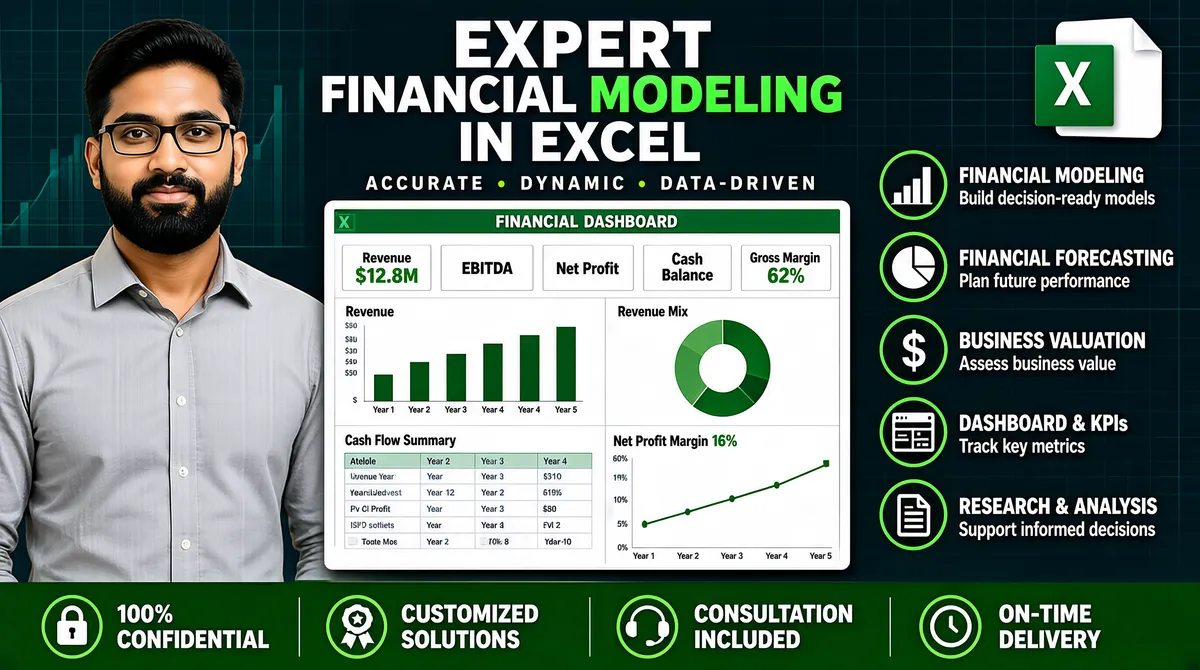
[Format] Landscape 16:9 gig cover, corporate financial-consulting infographic style. Crisp vector graphics over a photo cut-out, high detail, professional finish. No watermark, no personal names. [Layout] Dark teal-navy background with a faint financial grid and ghosted chart lines. Three vertical zones. Left third: a waist-up photo cut-out of the seller. Centre: the main column — a three-line headline block across the top, a tagline strip under it, then a large white Excel-style dashboard mockup card with a green FINANCIAL DASHBOARD title bar, containing five KPI mini-cards (Revenue $12.8M, EBITDA, Net Profit, Cash Balance, Gross Margin 62%), a green revenue bar chart over Year 1–Year 5, a blue-green revenue donut chart with a colour legend, a cash-flow summary table and a net-profit-margin line chart climbing to 16%; the card is the visual anchor, about one third of frame width. Right quarter: a vertical stack of five icon-plus-text feature rows, each a green outline circle icon with a bold white caps title and a small grey sub-caption. A full-width darker green strip runs along the bottom with four icon-and-text trust items separated by thin dividers. [Subject] A South Asian man in his late twenties, full black beard, rectangular glasses, light grey button-down shirt, waist-up, at the left edge, softly front-lit, looking at the camera with a calm confident expression; he overlaps nothing, the headline begins to his right. [Headline] Top centre, stacked in three lines each about one twelfth of frame height: "EXPERT" in heavy white caps, "FINANCIAL MODELING" in heavy bright-green caps, "IN EXCEL" in heavy white caps. Below them a tagline in letter-spaced white caps with green dot separators: "ACCURATE • DYNAMIC • DATA-DRIVEN". Right-column feature titles in white bold caps: "FINANCIAL MODELING", "FINANCIAL FORECASTING", "BUSINESS VALUATION", "DASHBOARD & KPIs", "RESEARCH & ANALYSIS". Bottom-strip labels in white bold caps: "100% CONFIDENTIAL", "CUSTOMIZED SOLUTIONS", "CONSULTATION INCLUDED", "ON-TIME DELIVERY". [Badges] Top right: the Microsoft Excel logo — a white document shape with a folded corner behind a green rounded square holding a white X, roughly one tenth of frame width. Right-column icons: bar chart, pie chart, dollar sign, dashboard grid and document glyphs in green outline circles. Bottom-strip icons: padlock, award ribbon, headset and clock in the same green outline style. [Mood] Deep teal-navy and vivid green with white type; analytical, trustworthy and data-dense. At thumbnail size the green headline line, the big white dashboard and the Excel mark stay legible and signal Excel-based financial modelling.
More Images