Generate
Create images with AI
Phosphorus Chemical Industry Dashboard
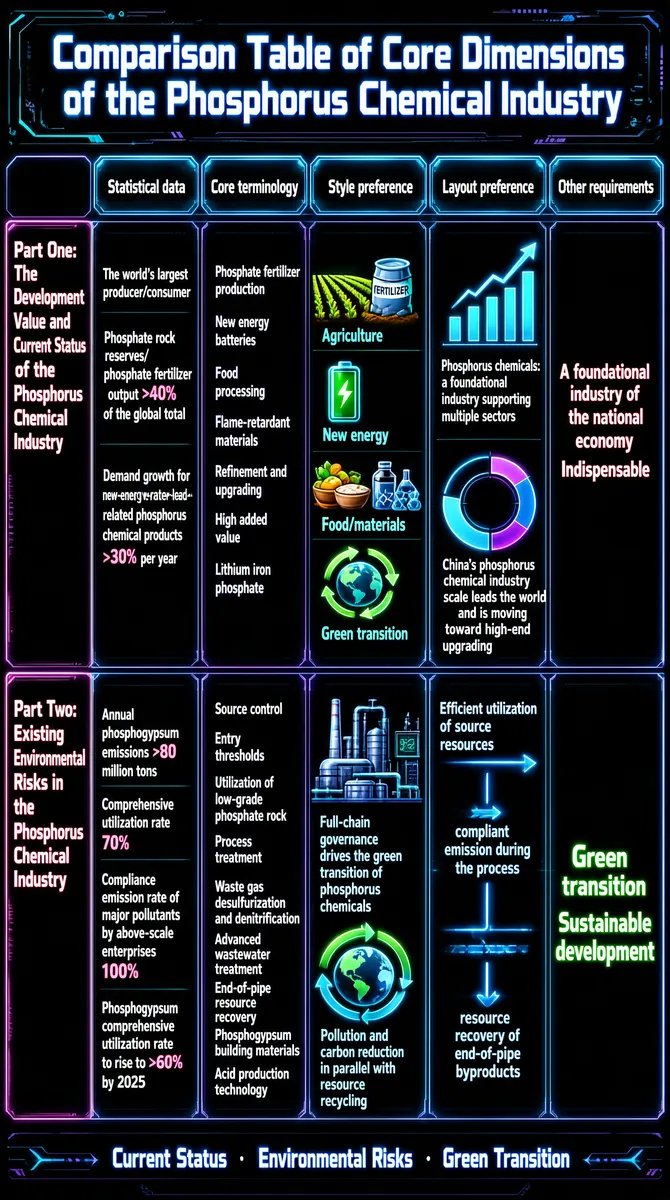
This infographic is titled "Comparison Table of Core Dimensions of the Phosphorus Chemical Industry," designed in a futuristic high-tech style with a dark background paired with fluorescent lines and text in neon blue, purple, and pink, presenting an overall visual effect of a digital dashboard or virtual interface. The chart structure is a table layout with multiple horizontal columns and three vertical rows: the left side holds three main thematic categories, and the top holds five analysis dimensions - statistical data, core terminology, style preference, layout preference, and other requirements. The chart content is divided into three main parts: **Part One: The Development Value and Current Status of the Phosphorus Chemical Industry** - **Statistical data**: - The world's largest producer/consumer - Phosphate rock reserves/phosphate fertilizer output >40% of the global total - Demand growth for new-energy-related phosphorus chemical products >30% per year - **Core terminology**: - Phosphate fertilizer production - New energy batteries - Food processing - Flame-retardant materials - Refinement and upgrading - High added value - Lithium iron phosphate - **Style preference** (with illustrations): - Agriculture (farmland + fertilizer bucket) - New energy (green phone battery) - Food/materials (food and chemicals) - Green transition (globe circulation icon) - **Layout preference** (combined text and graphics): - Phosphorus chemicals: a foundational industry supporting multiple sectors (bar chart with an upward trend) - China's phosphorus chemical industry scale leads the world and is moving toward high-end upgrading (ring-shaped growth chart) - **Other requirements**: - A foundational industry of the national economy - Indispensable **Part Two: Existing Environmental Risks in the Phosphorus Chemical Industry** - **Statistical data**: - Annual phosphogypsum emissions >80 million tons - Comprehensive utilization rate 70% - Compliance emission rate of major pollutants by above-scale enterprises 100% - Phosphogypsum comprehensive utilization rate to rise to >60% by 2025 - **Core terminology**: - Source control - Entry thresholds - Utilization of low-grade phosphate rock - Process treatment - Waste gas desulfurization and denitrification - Advanced wastewater treatment - End-of-pipe resource recovery - Phosphogypsum building materials - Acid production technology - **Style preference** (with illustrations): - Full-chain governance drives the green transition of phosphorus chemicals (smart factory) - Pollution and carbon reduction in parallel with resource recycling (globe with circular arrows) - **Layout preference** (blue flowchart): - Efficient utilization of source resources -> compliant emission during the process -> resource recovery of end-of-pipe byproducts - **Other requirements**: - Green transition - Sustainable development Through clear classification and data comparison, the entire infographic systematically presents the current status, challenges, and development direction of the phosphorus chemical industry, emphasizing its foundational position in the national economy while pointing out environmental pollution problems and the necessity of a green transition. Visual elements such as arrows, charts, prohibition symbols, and industrial-scene illustrations enhance the intuitiveness and warning quality of the information conveyed.
Tags
More Images