Generate
Create images with AI
Understanding Investment Fees and Net Returns Infographic
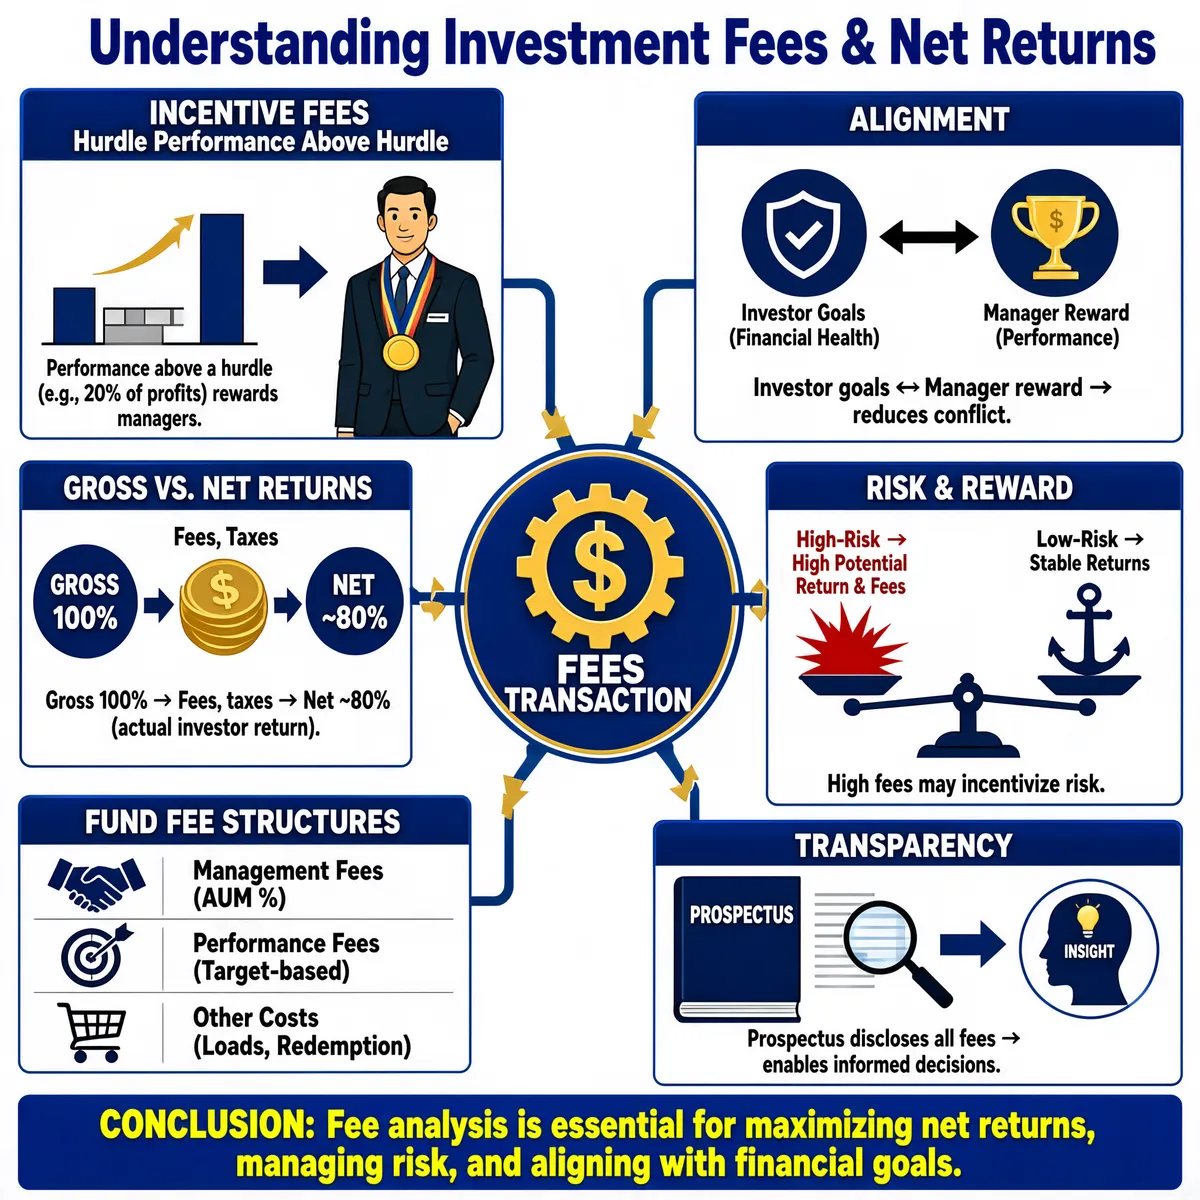
The infographic titled "Understanding Investment Fees & Net Returns" is designed to educate investors on the critical components of investment fees and their impact on net returns. The layout is radial, with a central circular element labeled "FEES TRANSACTION," featuring a gear icon with a dollar sign at its core, symbolizing the mechanical nature of financial transactions. From this center, six blue and gold pathways extend outward to six distinct rectangular panels, each addressing a specific aspect of investment fees. Each panel has a blue header with white text and an accompanying icon, followed by illustrative graphics and explanatory text in black font on a white background. The color scheme primarily uses shades of blue, gold, and white, creating a professional and clean aesthetic. 1. **INCENTIVE FEES** (Top-left panel, with a rising arrow and coin stack icon): - Contains a bar chart comparing "Hurdle" (blue bar) and "Performance Above Hurdle" (gold bar). - An arrow points from the gold bar to an illustration of a man in a suit receiving a medal. - Text: "Performance above a hurdle (e.g., 20% of profits) rewards managers." 2. **ALIGNMENT** (Top-right panel, with a handshake icon): - Features two circular icons connected by bidirectional arrows. - Left circle: Shield icon with text "Investor Goals (Financial Health)." - Right circle: Trophy icon with text "Manager Reward (Performance)." - Below: "Investor goals ↔ Manager reward → reduces conflict." 3. **GROSS VS. NET RETURNS** (Middle-left panel, with calculator and downward arrow icons): - Shows a flow: a blue circle labeled "GROSS 100%" → a blue circle with a dollar coin labeled "Fees, Taxes" → a gold circle labeled "NET ~80%." - Text below: "Gross 100% → Fees, taxes → Net ~80% (actual investor return)." 4. **RISK & REWARD** (Middle-right panel, with scales and lightning bolt icons): - Depicts a balance scale. - Left pan: Red upward arrow and explosion icon, labeled "High-Risk → High Potential Return & Fees." - Right pan: Anchor icon, labeled "Low-Risk → Stable Returns." - Below: "High fees may incentivize risk." 5. **FUND FEE STRUCTURES** (Bottom-left panel, with bank building and document icons): - Three horizontal sections with icons and labels: - Handshake icon: "Management Fees (AUM %)" - Target with arrow icon: "Performance Fees (Target-based)" - Shopping cart icon: "Other Costs (Loads, Redemption)" 6. **TRANSPARENCY** (Bottom-right panel, with magnifying glass and open book icons): - Illustrates an open book labeled "PROSPECTUS" being examined with a magnifying glass. - Arrow leads to a head silhouette with a lightbulb, symbolizing insight. - Text: "Prospectus discloses all fees → enables informed decisions." At the bottom, a wide blue banner contains the conclusion in bold yellow text: "CONCLUSION: Fee analysis is essential for maximizing net returns, managing risk, and aligning with financial goals." The infographic uses clear visual metaphors, consistent iconography, and structured data presentation to convey complex financial concepts in an accessible manner. All textual content is in English, and the design emphasizes clarity and logical flow from central concept to detailed components.
Tags
More Images



![[Format] Landscape 16:9 gig cover, sharp diagonal-cut layout](https://files.posterlet.com/assets/generated/md/2w0gm65hs2gj.webp)