Generate
Create images with AI
Quantitative Research & Analysis Services
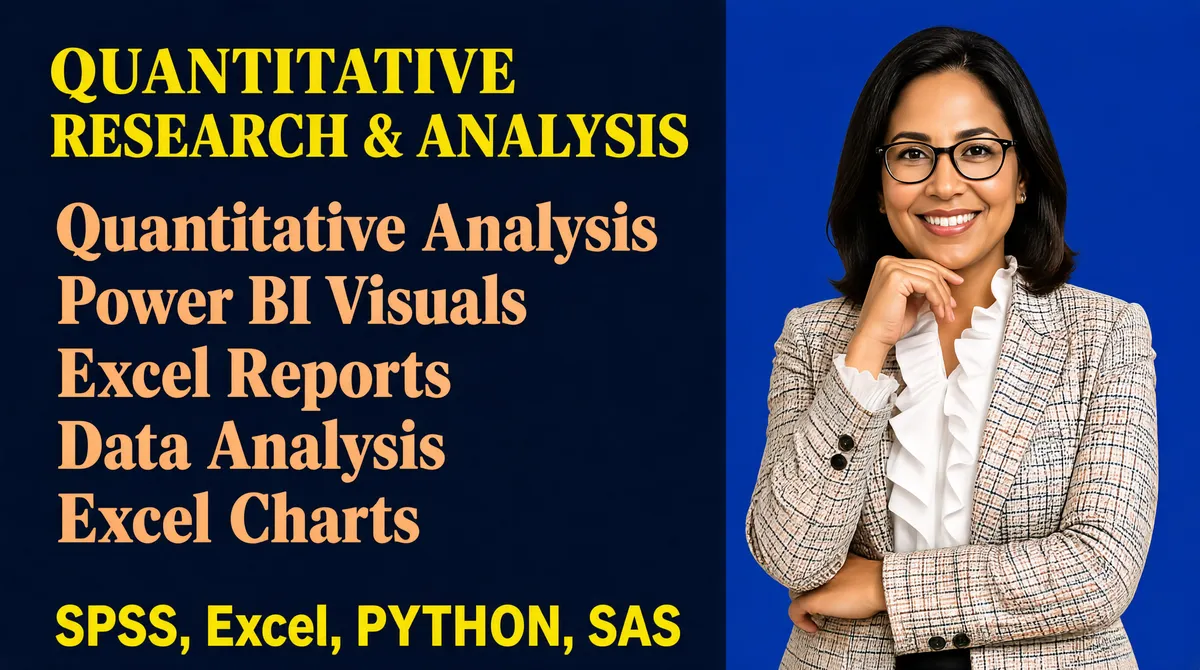
[Format] Landscape 16:9 gig cover, clean professional graphic-design style with smooth cut-out photography and solid color blocks. Crisp finish, no watermark, no personal names. [Layout] A two-zone horizontal composition: the left two-thirds of the frame is a flat dark-blue text field, while the right third is occupied by a waist-up cut-out of a woman. The text is stacked vertically in the left zone with generous line spacing; a single line of tool names sits near the bottom edge, spanning the full width. [Subject] A smiling woman with glasses and shoulder-length dark hair, wearing a light plaid blazer over a white ruffled blouse, posed with one hand resting under her chin and the other arm crossed. Waist-up, even studio lighting, placed on the right edge and overlapping slightly into the center. [Headline] Top line in all-caps yellow serif lettering reads "QUANTITATIVE RESEARCH & ANALYSIS". Below it, five lines of large peach-orange serif text stacked flush-left read "Quantitative Analysis", "Power BI Visuals", "Excel Reports", "Data Analysis" and "Excel Charts". Near the bottom, a yellow all-caps sans-serif line reads "SPSS, Excel, PYTHON, SAS". [Badges] No separate badge icons; the bottom tool line functions as a typographic badge strip. Power BI, Excel, SPSS and SAS are named as text. [Mood] Deep navy and royal blue background with bright yellow and warm peach accents; business-academic, approachable and confident. The thumbnail reads as a tidy list of services next to a friendly professional.
Tags
More Images