Generate
Create images with AI
Automotive Software Trends Infographic 2024-2030
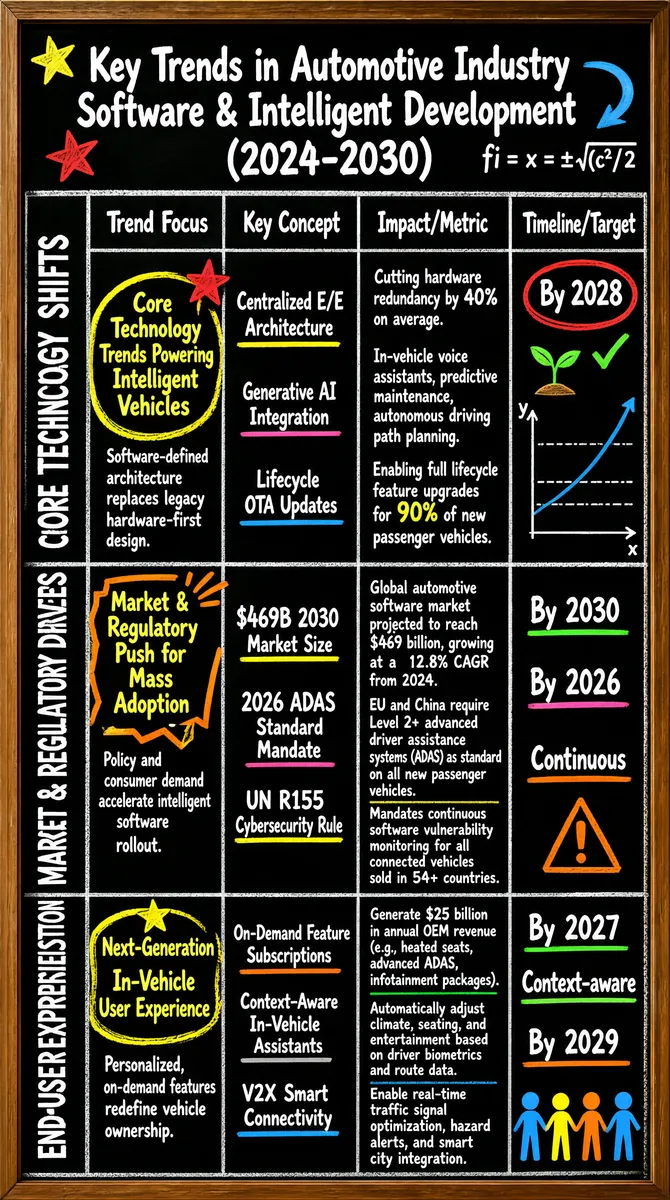
The infographic, titled "Key Trends in Automotive Industry Software & Intelligent Development (2024-2030)", is presented in a visually engaging chalkboard-style format with a wooden frame. The background mimics a black chalkboard with white, colored chalk-like text and hand-drawn illustrations, including stars, arrows, checkmarks, graphs, and erasers, giving it an educational and creative aesthetic. The title is prominently displayed at the top in bold white text, with decorative elements like a yellow star, a blue curved arrow, and a mathematical formula “fi = x = ±√(c²)/2” in the upper right corner. The content is organized into a structured table with four main columns: **Trend Focus**, **Key Concept**, **Impact/Metric**, and **Timeline/Target**. The rows are grouped under three primary vertical categories on the left side, written vertically in bold white text: **CORE TECHNOLOGY SHIFTS**, **MARKET & REGULATORY DRIVERS**, and **END-USER EXPERIENCE EVOLUTION**. Each category has its own sub-section with distinct visual icons and color-coded highlights. --- ### CORE TECHNOLOGY SHIFTS This section focuses on foundational technological advancements powering intelligent vehicles. - **Trend Focus**: - *Core Technology Trends Powering Intelligent Vehicles* — highlighted in a yellow circle with a red star icon. - Subtext: “Software-defined architecture replaces legacy hardware-first design.” - **Key Concepts**: 1. **Centralized E/E Architecture** — underlined in yellow. 2. **Generative AI Integration** — underlined in pink. 3. **Lifecycle OTA Updates** — underlined in blue, accompanied by a small diagram of a star → circle → checkmark. - **Impact/Metric**: 1. Cutting hardware redundancy by 40% on average. 2. In-vehicle voice assistants, predictive maintenance, autonomous driving path planning. 3. Enabling full lifecycle feature upgrades for 90% of new passenger vehicles. - **Timeline/Target**: - A green checkmark and a growing plant icon indicate progress. - “By 2028” circled in red. - A blue growth curve graph labeled “y” vs. “x” with dashed lines indicating thresholds. --- ### MARKET & REGULATORY DRIVERS This section outlines external forces accelerating adoption. - **Trend Focus**: - *Market & Regulatory Push for Mass Adoption* — highlighted in yellow with orange rays and a downward arrow. - Subtext: “Policy and consumer demand accelerate intelligent software rollout.” - **Key Concepts**: 1. **$469B 2030 Market Size** — underlined in yellow, with a curved blue arrow pointing back to the concept. 2. **2026 ADAS Standard Mandate** — underlined in pink. 3. **UN R155 Cybersecurity Rule** — underlined in yellow, with a blue cube and cross symbol. - **Impact/Metric**: 1. Global automotive software market projected to reach $469 billion, growing at a 12.8% CAGR from 2024. 2. EU and China require Level 2+ advanced driver assistance systems (ADAS) as standard on all new passenger vehicles. 3. Mandates continuous software vulnerability monitoring for all connected vehicles sold in 54+ countries. - **Timeline/Target**: - “By 2030” underlined in green. - “By 2026” underlined in pink. - “Continuous” underlined in orange, with a warning triangle and a blue arrow. --- ### END-USER EXPERIENCE EVOLUTION This section details innovations enhancing user interaction and personalization. - **Trend Focus**: - *Next-Generation In-Vehicle User Experience* — highlighted in yellow with a star icon. - Subtext: “Personalized, on-demand features redefine vehicle ownership.” - **Key Concepts**: 1. **On-Demand Feature Subscriptions** — underlined in orange. 2. **Context-Aware In-Vehicle Assistants** — underlined in gray. 3. **V2X Smart Connectivity** — underlined in blue, with a green checkmark. - **Impact/Metric**: 1. Generate $25 billion in annual OEM revenue (e.g., heated seats, advanced ADAS, infotainment packages). 2. Automatically adjust climate, seating, and entertainment based on driver biometrics and route data. 3. Enable real-time traffic signal optimization, hazard alerts, and smart city integration. - **Timeline/Target**: - “By 2027” underlined in green with a checkmark. - “Context-aware” underlined in green. - “By 2029” underlined in orange, with a group of stick figures in different colors (blue, yellow, orange, blue). --- Overall, the infographic uses a combination of text, color-coding (yellow, pink, blue, green, orange), hand-drawn icons, and symbolic diagrams to convey complex information clearly and memorably. The visual style enhances readability and emphasizes key milestones, impacts, and timelines, making it suitable for presentations or strategic planning documents in the automotive industry. All textual content is in English, which constitutes the majority of visible text.
Tags
More Images