Generate
Create images with AI
Polyploidy in Agriculture Chromosome Counts
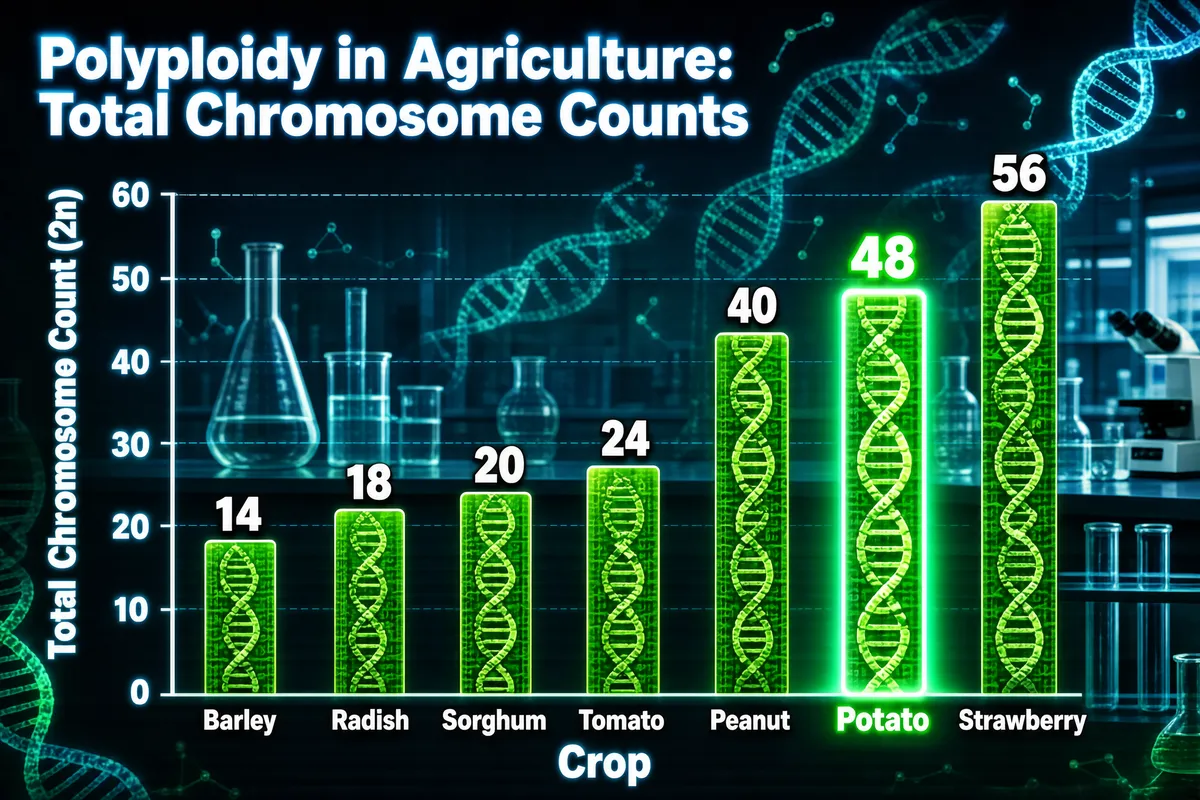
Create an infographic featuring a title 'Polyploidy in Agriculture: Total Chromosome Counts' at the top left. The main element is a vertical bar chart set against a biotech laboratory background with glowing DNA strands and lab equipment. The horizontal x-axis is labeled 'Crop' and lists the crop names, while the vertical y-axis is labeled 'Total Chromosome Count (2n)' with values from 0 to 60. Each bar represents a specific crop and contains a DNA-helix patterned fill in shades of green. Each bar is topped with its specific numerical chromosome count as a data label. The bar for 'Potato' is uniquely highlighted with a distinct glowing effect. The overall color scheme is dominated by leafy greens and cool laboratory blues. The given data is : [{"chromosomes_2n": 14, "crop": "Barley"}, {"chromosomes_2n": 18, "crop": "Radish"}, {"chromosomes_2n": 20, "crop": "Sorghum"}, {"chromosomes_2n": 24, "crop": "Tomato"}, {"chromosomes_2n": 40, "crop": "Peanut"}, {"chromosomes_2n": 48, "crop": "Potato"}, {"chromosomes_2n": 56, "crop": "Strawberry"}]
More Images