Generate
Create images with AI
American Options Flexibility Strategy Infographic
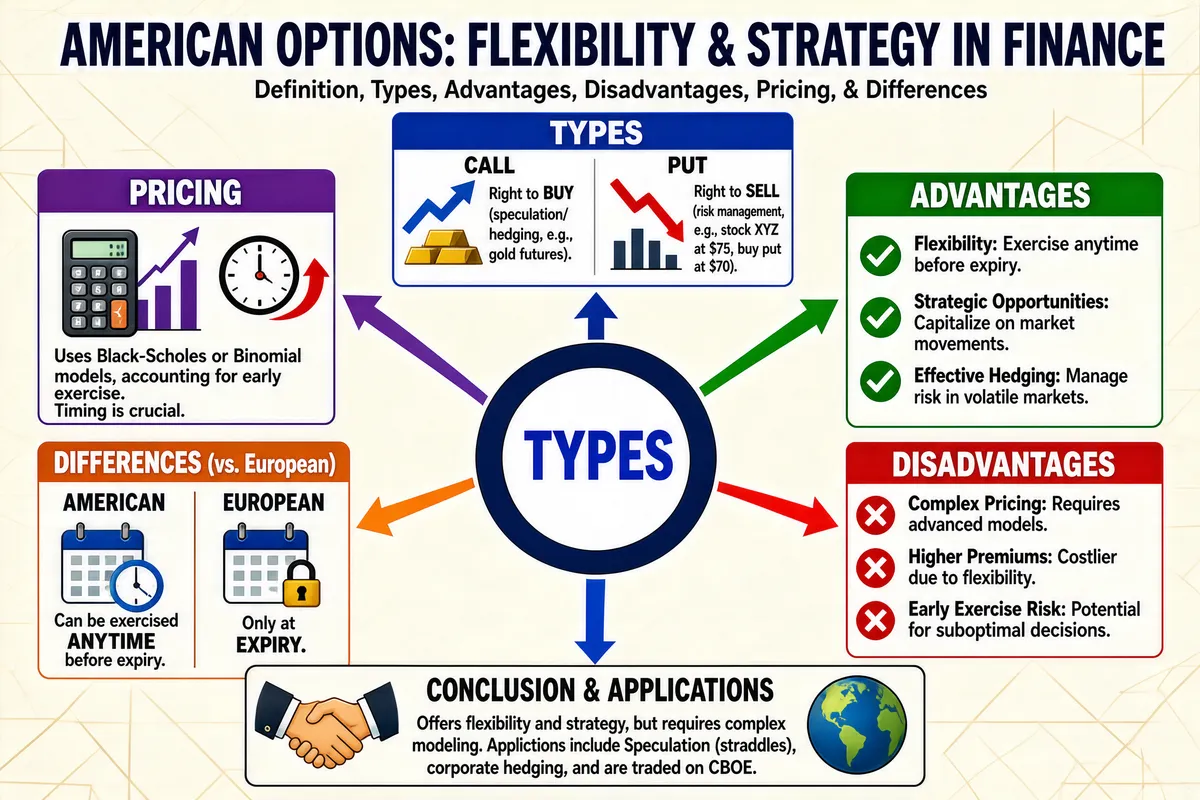
The infographic titled "AMERICAN OPTIONS: FLEXIBILITY & STRATEGY IN FINANCE" provides a comprehensive overview of American options, with a subtitle listing the covered topics: Definition, Types, Advantages, Disadvantages, Pricing, & Differences. The design features a central circular hub labeled "TYPES" in bold blue text, surrounded by six colored arrows pointing to corresponding rectangular information boxes arranged radially around it. The background is light cream with subtle geometric line patterns, giving a clean, professional appearance. At the center, the word "TYPES" is enclosed in a dark blue ring with a white inner circle, serving as the focal point. From this center, six arrows—blue, green, red, orange, purple, and another blue—radiate outward to connect to the six main content sections. **1. TYPES Section (Top Center)** - Header: "TYPES" in white text on a blue banner. - Two subtypes are presented side-by-side: - **CALL**: Illustrated with a blue upward-trending arrow and gold bars. Text: "Right to BUY (speculation/hedging, e.g., gold futures)." - **PUT**: Illustrated with a red downward-trending arrow and a bar chart. Text: "Right to SELL (risk management, e.g., stock XYZ at $75, buy put at $70)." **2. ADVANTAGES Section (Top Right)** - Header: "ADVANTAGES" in white text on a green banner. - Three bullet points with green checkmarks: - Flexibility: Exercise anytime before expiry. - Strategic Opportunities: Capitalize on market movements. - Effective Hedging: Manage risk in volatile markets. **3. DISADVANTAGES Section (Bottom Right)** - Header: "DISADVANTAGES" in white text on a red banner. - Three bullet points with red X marks: - Complex Pricing: Requires advanced models. - Higher Premiums: Costlier due to flexibility. - Early Exercise Risk: Potential for suboptimal decisions. **4. PRICING Section (Top Left)** - Header: "PRICING" in white text on a purple banner. - Two key points: - Uses Black-Scholes or Binomial models, accounting for early exercise. (Accompanied by an icon of a calculator with a rising graph.) - Timing is crucial. (Accompanied by a clock icon with a red arrow.) **5. DIFFERENCES (vs. European) Section (Bottom Left)** - Header: "DIFFERENCES (vs. European)" in white text on an orange banner. - Two comparative panels: - **AMERICAN**: Calendar icon with a clock. Text: "Can be exercised ANYTIME before expiry." - **EUROPEAN**: Calendar icon with a lock. Text: "Only at EXPIRY." **6. CONCLUSION & APPLICATIONS Section (Bottom Center)** - Header: "CONCLUSION & APPLICATIONS" in black text, flanked by a handshake icon and a globe icon. - Text: "Offers flexibility and strategy, but requires complex modeling. Applications include Speculation (straddles), corporate hedging, and are traded on CBOE." The overall layout is radial and symmetrical, emphasizing the centrality of "TYPES" while clearly organizing related concepts around it. Visual elements such as icons (calculator, clock, calendar, lock, handshake, globe, arrows, gold bars, charts) enhance comprehension. The color coding (blue for types, green for advantages, red for disadvantages, purple for pricing, orange for differences) aids visual distinction. All textual content is preserved verbatim, including examples like "stock XYZ at $75, buy put at $70" and specific model names like "Black-Scholes or Binomial models." The infographic effectively communicates both foundational knowledge and strategic considerations for American options in financial markets.
Tags
More Images