Generate
Create images with AI
The Evolution of Earth's Oxygen
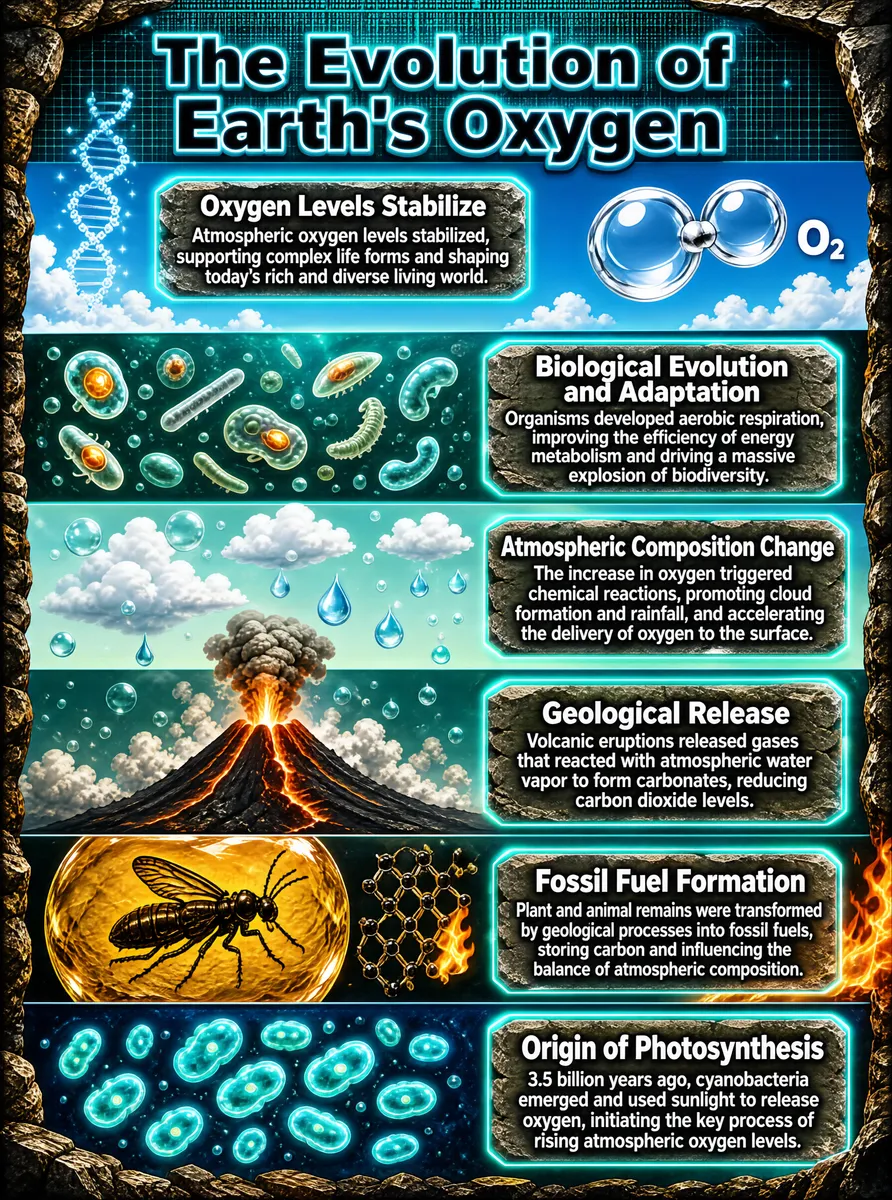
This infographic, titled "The Evolution of Earth's Oxygen," adopts a vertically layered layout presenting the key stages in the evolution of oxygen content in Earth's atmosphere from bottom to top. The overall design blends sci-fi and natural elements, with a teal-green color scheme complemented by rock-textured borders and glowing particle effects, creating a sense of deep geologic time. Each evolutionary stage is presented as an independent horizontal module containing explanatory text and corresponding illustrative imagery, with gradient color bands linking the modules into a clear timeline narrative. The title "The Evolution of Earth's Oxygen" sits at the top center in bold 3D lettering — black fill with blue outlines and a grid-like tech texture — emphasizing the scientific and grand scale of the theme. The infographic consists of six major modules, from bottom to top: 1. **Origin of Photosynthesis** - Text content: "3.5 billion years ago, cyanobacteria emerged and used sunlight to release oxygen, initiating the key process of rising atmospheric oxygen levels." - Visual elements: Against a deep blue background, multiple glowing cyanobacteria cells appear (spherical or chain-shaped), with fluorescent dots inside the cells simulating the process of photosynthesis; a woody rock-strata texture at the bottom symbolizes geological layers. 2. **Fossil Fuel Formation** - Text content: "Plant and animal remains were transformed by geological processes into fossil fuels, storing carbon and influencing the balance of atmospheric composition." - Visual elements: An insect fossil encased in amber resin embedded in a wood-grain background; below it, a honeycomb-patterned carbon molecular structure; flame effects on the right hint at the process of combustion, reflecting the carbon cycle and energy storage. 3. **Geological Release** - Text content: "Volcanic eruptions released gases that reacted with atmospheric water vapor to form carbonates, reducing carbon dioxide levels." - Visual elements: An image of a volcanic eruption with lava flows and thick billowing smoke surrounded by clouds, showing how geological activity regulates atmospheric composition. 4. **Atmospheric Composition Change** - Text content: "The increase in oxygen triggered chemical reactions, promoting cloud formation and rainfall, and accelerating the delivery of oxygen to the surface." - Visual elements: A pale blue-green sky background with floating white clouds and water droplets, accompanied by tiny rising bubbles, depicting oxygen-driven changes in the climate and hydrological cycles. 5. **Biological Evolution and Adaptation** - Text content: "Organisms developed aerobic respiration, improving the efficiency of energy metabolism and driving a massive explosion of biodiversity." - Visual elements: A deep-sea or microscopic world scene in which microbes of various shapes (such as bacteria and protozoa) swim through a glowing environment, some cells containing orange energy cores that symbolize aerobic metabolism. 6. **Oxygen Levels Stabilize** - Text content: "Atmospheric oxygen levels stabilized, supporting complex life forms and shaping today's rich and diverse living world." - Visual elements: A clear blue sky with white clouds; a transparent molecular model of oxygen (O₂) in the upper-right corner; a glowing DNA double-helix particle trail on the left, symbolizing the close link between life's evolution and oxygen. All text labels are placed in translucent dialog boxes with a faux-stone texture edged in cyan halos, enhancing readability and the sense of technology. There is no explicit numeric axis or coordinate system between modules; instead, the timeline logic is constructed through spatial ordering and visual transitions. The infographic uses no charts (such as bar or line graphs), conveying scientific concepts through a combination of text and imagery that emphasizes process over quantified data. Through its six-stage progressive structure, the chart systematically traces how Earth's oxygen evolved from nothing to abundance to stability, spanning biology, geology, chemistry, and climatology — an educational and artistic work of popular science.
Tags
More Images