Generate
Create images with AI
Social Insurance Infographic Iceberg Design
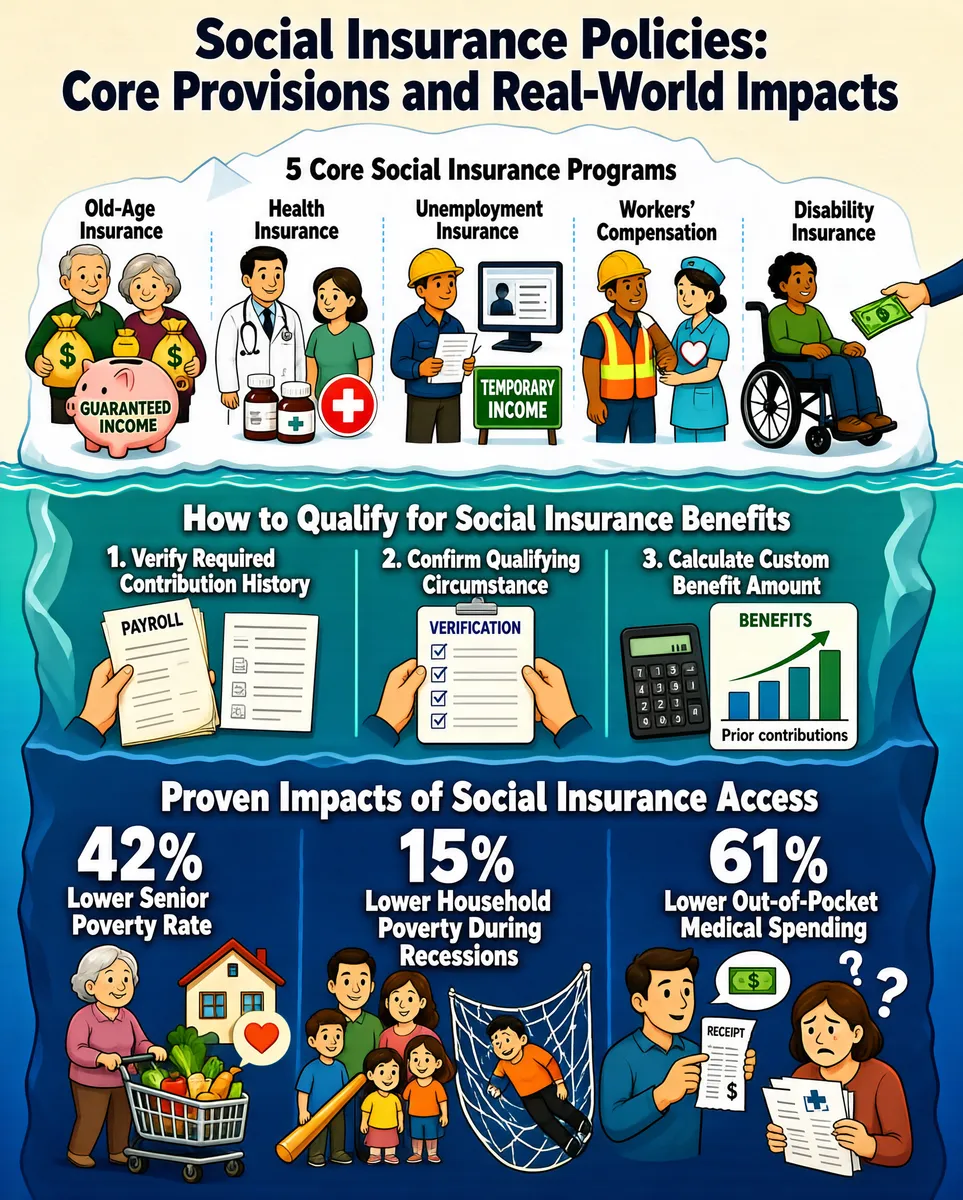
The infographic titled **"Social Insurance Policies: Core Provisions and Real-World Impacts"** is visually structured as an iceberg, symbolizing the visible surface-level programs and the deeper, underlying mechanisms and impacts. The design uses a soft beige background for the above-water portion and a layered blue gradient for the submerged sections, with cartoon-style illustrations to represent concepts. --- ### **Section 1: Core Social Insurance Types (Above Water)** This section presents the **5 Core Social Insurance Programs**, each addressing a specific financial risk, illustrated with icons and characters: 1. **Old-Age Insurance** - Visual: An elderly couple holding money bags, standing beside a piggy bank labeled "GUARANTEED INCOME". - Text: "Old-Age Insurance" 2. **Health Insurance** - Visual: A doctor in a white coat and a patient with medicine bottles; a red cross icon is present. - Text: "Health Insurance" 3. **Unemployment Insurance** - Visual: A worker in a hard hat holding a document, with a computer screen showing a job listing and a green sign reading "TEMPORARY INCOME". - Text: "Unemployment Insurance" 4. **Workers’ Compensation** - Visual: An injured worker in a hard hat and safety vest with a bandaged arm, being comforted by a nurse holding a heart symbol. - Text: "Workers’ Compensation" 5. **Disability Insurance** - Visual: A person in a wheelchair receiving money from another person’s hand. - Text: "Disability Insurance" --- ### **Section 2: Standard Benefit Eligibility Rules (First Submerged Layer)** Titled **"How to Qualify for Social Insurance Benefits"**, this layer details a three-step process using illustrative icons: 1. **Verify Required Contribution History** - Visual: Payroll stub and contribution records documents. - Text: "1. Verify Required Contribution History" 2. **Confirm Qualifying Circumstance** - Visual: Hands holding a checklist labeled "VERIFICATION" with checkmarks. - Text: "2. Confirm Qualifying Circumstance" 3. **Calculate Custom Benefit Amount** - Visual: A calculator next to a bar chart labeled "BENEFITS" with an upward trend line and "Prior contributions" on the x-axis. - Text: "3. Calculate Custom Benefit Amount" --- ### **Section 3: Measurable Impacts of Social Insurance Access (Deeper Submerged Layers)** This section, titled **"Proven Impacts of Social Insurance Access"**, displays three key statistical outcomes with corresponding illustrations: 1. **42% Lower Senior Poverty Rate** - Visual: An elderly woman shopping with a cart full of groceries, walking toward a house, with a heart symbol indicating well-being. - Text: "42% Lower Senior Poverty Rate" 2. **15% Lower Household Poverty During Recessions** - Visual: A child holding a baseball bat, a family of four standing together, and a person falling into a safety net (symbolizing economic protection). - Text: "15% Lower Household Poverty During Recessions" 3. **61% Lower Out-of-Pocket Medical Spending** - Visual: A man holding a receipt with a speech bubble containing a dollar bill, and a distressed woman with medical documents and question marks around her head. - Text: "61% Lower Out-of-Pocket Medical Spending" --- ### **Overall Layout and Style** The infographic employs a **layered iceberg metaphor** to organize information hierarchically: - **Above water**: Core program types (visible, foundational). - **Below water**: Eligibility rules and real-world impacts (hidden but critical). The visual style is **clean, colorful, and accessible**, using simple illustrations and clear typography. All text is in English, and the layout ensures logical flow from general programs to specific eligibility and then to measurable societal benefits. Data encoding is primarily **text-based with supporting icons and charts**, emphasizing clarity over complex data visualization. No numerical scales or axes are used beyond the simple bar chart in Section 2, which shows increasing benefits relative to prior contributions. This infographic effectively communicates the structure, access criteria, and tangible benefits of social insurance systems in a digestible, visually engaging format.
Tags
More Images