Generate
Create images with AI
R-Squared Explained: Model Fit from Formula to Interpretation
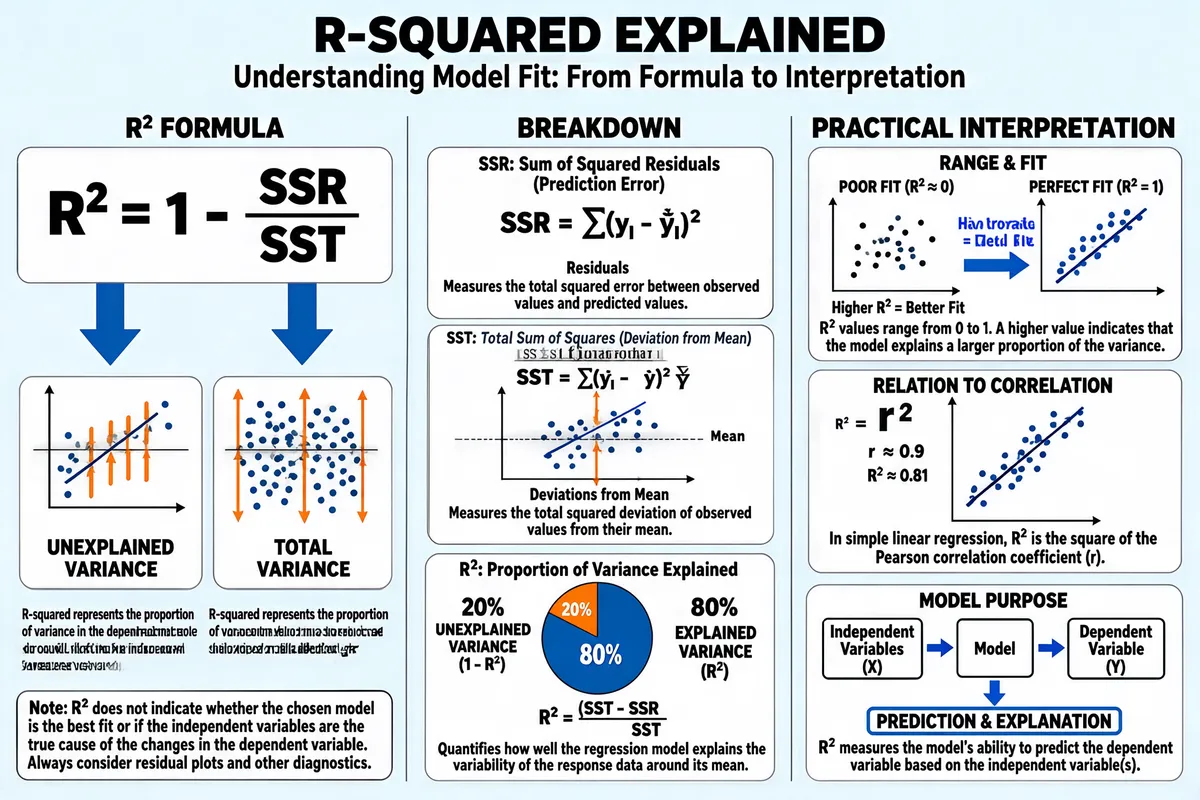
The infographic titled "R-SQUARED EXPLAINED" with the subtitle "Understanding Model Fit: From Formula to Interpretation" is structured into three main vertical columns: "R² FORMULA", "BREAKDOWN", and "PRACTICAL INTERPRETATION". The overall design uses a clean, professional layout with a light blue background, black text for headings and key formulas, and blue arrows and icons for visual guidance. Each section is separated by thin vertical lines, and sub-sections are enclosed in rounded rectangular boxes with light gray borders. **Column 1: R² FORMULA** This column presents the core formula for R-squared: **R² = 1 - (SSR / SST)** Two large blue arrows point downward from the fraction SSR/SST to two labeled diagrams below: - Left arrow points to "UNEXPLAINED VARIANCE", illustrated by a scatter plot with a regression line and vertical orange lines (residuals) between data points and the line. - Right arrow points to "TOTAL VARIANCE", depicted as a cloud with upward and downward orange arrows indicating deviations from a horizontal mean line. Below these visuals, two identical paragraphs state: "R-squared represents the proportion of variance in the dependent variable that is predictable from the independent variable(s)." At the bottom of this column, a note reads: "Note: R² does not indicate whether the chosen model is the best fit or if the independent variables are the true cause of the changes in the dependent variable. Always consider residual plots and other diagnostics." **Column 2: BREAKDOWN** This column contains three subsections: 1. **SSR: Sum of Squared Residuals (Prediction Error)** - Formula: **SSR = Σ(yᵢ - ŷᵢ)²** - Visual: A scatter plot with a regression line and vertical orange lines labeled "Residuals" connecting observed data points to the predicted values on the line. - Description: "Measures the total squared error between observed values and predicted values." 2. **SST: Total Sum of Squares (Deviation from Mean)** - Formula: **SST = Σ(yᵢ - ȳ)²** - Visual: A scatter plot with a regression line and dashed horizontal line labeled "ȳ" (mean). Vertical orange lines labeled "Deviations from Mean" connect data points to the mean line. - Description: "Measures the total squared deviation of observed values from their mean." 3. **R²: Proportion of Variance Explained** - Visual: A pie chart divided into two segments: - Orange segment: 20%, labeled "UNEXPLAINED VARIANCE (1 - R²)" - Blue segment: 80%, labeled "EXPLAINED VARIANCE (R²)" - Alternative formula: **R² = (SST - SSR) / SST** - Description: "Quantifies how well the regression model explains the variability of the response data around its mean." **Column 3: PRACTICAL INTERPRETATION** This column includes three subsections: 1. **RANGE & FIT** - Visual: Two scatter plots side-by-side. - Left: Scattered points with no clear trend, labeled "POOR FIT (R² ≈ 0)". - Right: Points closely aligned along a diagonal line, labeled "PERFECT FIT (R² = 1)". - Arrow between them labeled "Higher R² = Better Fit". - Text: "R² values range from 0 to 1. A higher value indicates that the model explains a larger proportion of the variance." 2. **RELATION TO CORRELATION** - Formula: **R² = r²** - Visual: Scatter plot with points forming a strong positive linear trend, regression line, and labels: - "r ≈ 0.9" - "R² ≈ 0.81" - Text: "In simple linear regression, R² is the square of the Pearson correlation coefficient (r)." 3. **MODEL PURPOSE** - Visual: Flowchart with three boxes connected by arrows: - "Independent Variables (X)" → "Model" → "Dependent Variable (Y)" - Downward arrow from "Model" to "PREDICTION & EXPLANATION" - Text: "R² measures the model's ability to predict the dependent variable based on the independent variable(s)." The infographic uses consistent visual encoding: blue for explained variance and model components, orange for residuals and unexplained variance, and gray for mean lines and background elements. All mathematical symbols and Greek letters (e.g., Σ, yᵢ, ŷᵢ, ȳ, r) are rendered clearly. The content is educational, aimed at helping users understand R-squared from both mathematical and conceptual perspectives.
Tags
More Images






![[Format] Landscape 16:9 gig cover, flat black poster-style s](https://files.posterlet.com/assets/generated/md/xcpqmv7z0gjr.webp)