Generate
Create images with AI
Project Feasibility Study Comic Infographic
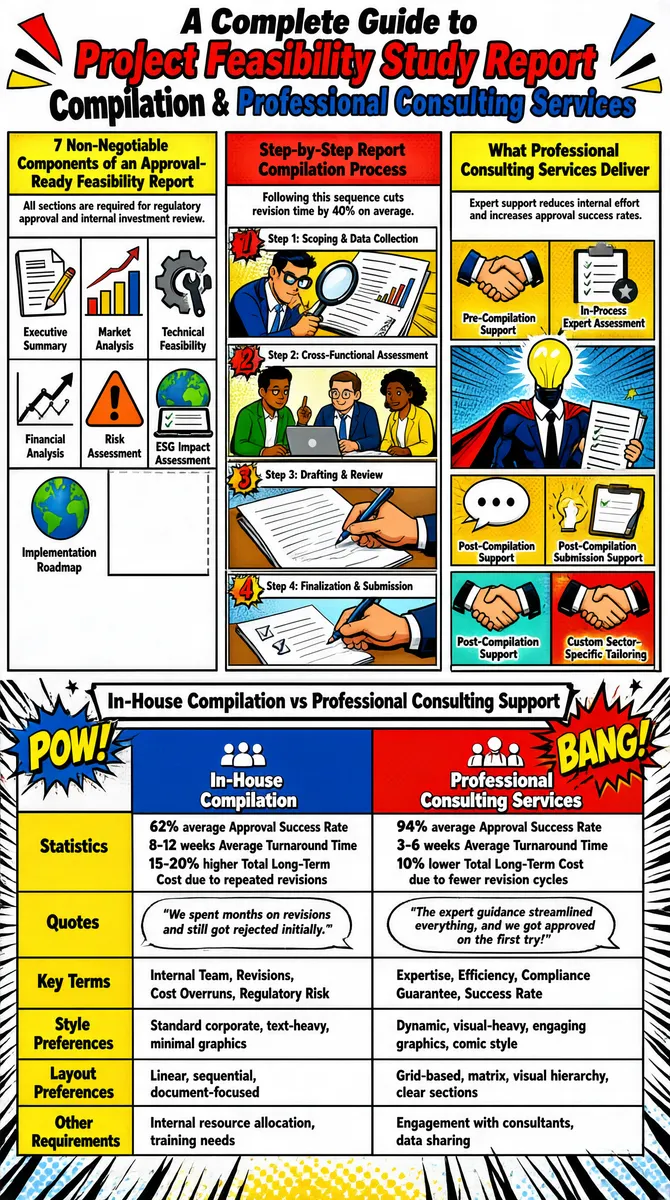
This infographic, titled "A Complete Guide to Project Feasibility Study Report Compilation & Professional Consulting Services," is designed in a vibrant comic book style with bold colors, dynamic action words like "POW!" and "BANG!", and speech bubbles to convey information in an engaging, visual format. The layout is divided into three main vertical sections at the top and one large comparative table at the bottom, all set against a white background with black comic-style motion lines framing the lower half. The first section on the left, labeled "7 Non-Negotiable Components of an Approval-Ready Feasibility Report," states that all sections are required for regulatory approval and internal investment review. It presents seven components in a 3x3 grid (with the last cell partially empty), each represented by a colorful icon and label: - Executive Summary (icon: document with pencil) - Market Analysis (icon: upward bar chart) - Technical Feasibility (icon: gear with wrench) - Financial Analysis (icon: upward line graph) - Risk Assessment (icon: yellow warning triangle with exclamation mark) - ESG Impact Assessment (icon: globe) - Implementation Roadmap (icon: checklist on laptop) The middle section, titled "Step-by-Step Report Compilation Process," claims following this sequence cuts revision time by 40% on average. It illustrates four steps using comic panels: - Step 1: Scoping & Data Collection (icon: person with magnifying glass over document) - Step 2: Cross-Functional Assessment (icon: three people collaborating around a laptop) - Step 3: Drafting & Review (icon: hands writing on a document) - Step 4: Finalization & Submission (icon: hand writing on a document with a question mark and sigma symbol in a speech bubble) The rightmost top section, "What Professional Consulting Services Deliver," explains how expert support reduces internal effort and increases approval success rates. It lists six services in comic-style panels: - Pre-Compilation Support (icon: handshake) - In-Process Expert Assessment (icon: superhero figure with lightbulb head holding documents) - Post-Compilation Support (icon: speech bubble with text) - Post-Compilation Submission Support (icon: "BANG" explosion) - Custom Sector-Specific Tailoring (icon: handshake) The bottom half of the infographic is dedicated to a comparison titled "In-House Compilation vs Professional Consulting Support." This section uses a two-row, six-column table format with alternating red and yellow headers. The rows represent the two approaches: "In-House Compilation" (blue panel with "POW!") and "Professional Consulting Services" (red panel with "BANG!"). The columns compare the following categories: | Category | In-House Compilation | Professional Consulting Services | |----------------------|--------------------------------------------------------------------------------------|--------------------------------------------------------------------------------------------------| | **Statistics** | 62% average Approval Success Rate8-12 weeks Average Turnaround Time15-20% higher Total Long-Term Cost due to repeated revisions | 94% average Approval Success Rate3-6 weeks Average Turnaround Time10% lower Total Long-Term Cost due to fewer revision cycles | | **Quotes** | We spent months on revisions and still got rejected initially. | The expert guidance streamlined everything, and we got approved on the first try! | | **Key Terms** | Internal Team, Revisions, Cost Overruns, Regulatory Risk | Expertise, Efficiency, Compliance Guarantee, Success Rate | | **Style Preferences**| Standard corporate, text-heavy, minimal graphics | Dynamic, visual-heavy, engaging graphics, comic style | | **Layout Preferences**| Linear, sequential, document-focused | Grid-based, matrix, visual hierarchy, clear sections | | **Other Requirements**| Internal resource allocation, training needs | Engagement with consultants, data sharing | All textual content is presented in English, using sans-serif fonts of varying weights and sizes for emphasis. The visual elements consistently use a pop-art aesthetic with halftone patterns, bold outlines, and primary color schemes (red, blue, yellow) to differentiate sections and draw attention to key points. The overall design effectively communicates complex business information through an accessible, energetic, and memorable comic book format.
Tags
More Images