Generate
Create images with AI
Neural Logic of Dream Generation Infographic
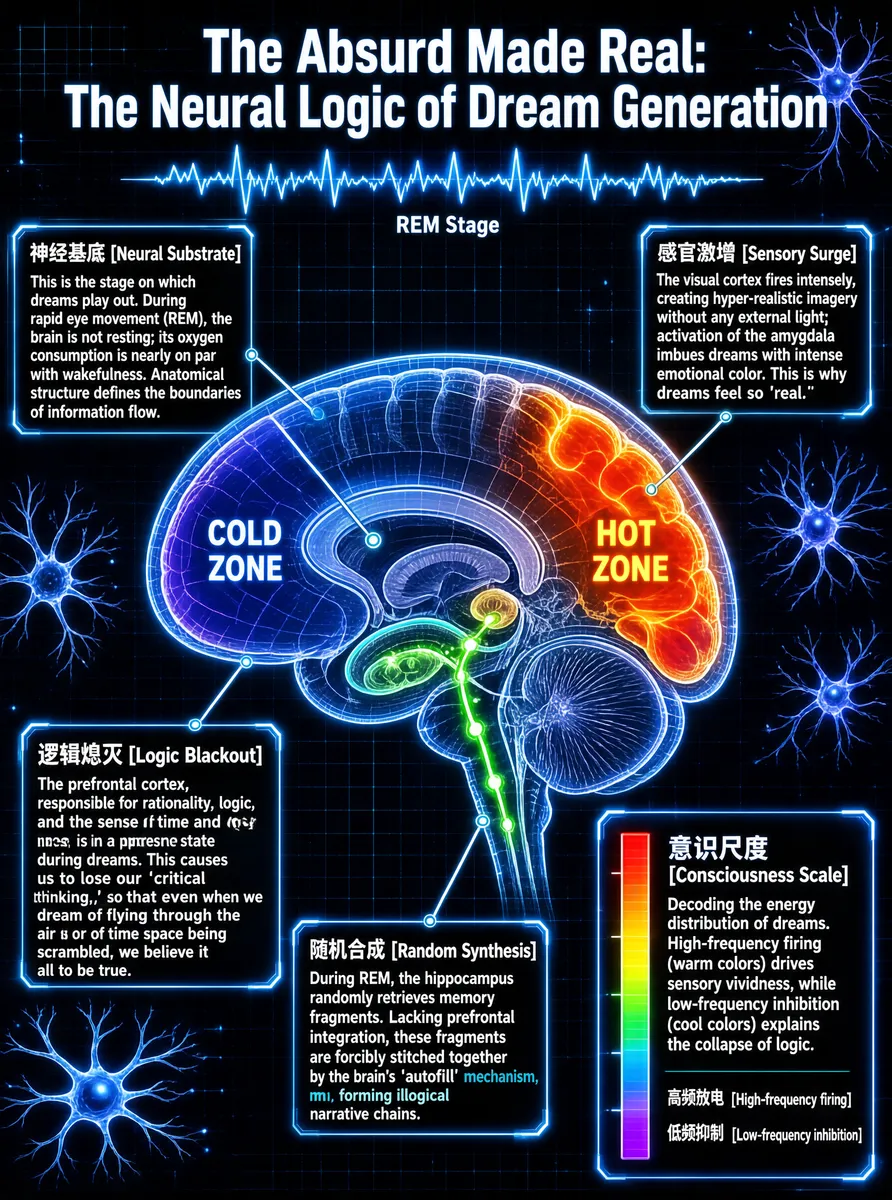
This infographic is titled "The Absurd Made Real: The Neural Logic of Dream Generation." Against a deep-blue tech-style background, it presents at the center a translucent sagittal cross-section of a human brain, whose interior visualizes the activity levels of different brain regions through color gradients and glowing lines. The overall layout is a symmetrical radial structure, with five main explanatory modules distributed around the brain image, each connected by a thin line to the corresponding brain region and explained in a bordered dark text box. In the lower right corner is a color scale (the consciousness-intensity gradient), transitioning from purple (low-frequency inhibition) to yellow/orange (high-frequency firing), used to decode the brain's energy distribution. **Title and Top Elements:** - The title "The Absurd Made Real: The Neural Logic of Dream Generation" sits at the top center in light-blue bold lettering. - Below the title is a waveform chart representing brainwaves, labeled in the middle "REM Stage," indicating that the entire analysis focuses on the rapid eye movement sleep phase. **Central Visual — The Brain Image:** - The human brain is rendered in an X-ray see-through style, its outline traced by blue grid lines, with internal structures such as the hippocampus, amygdala, and prefrontal cortex visible. - The brain is divided into two zones: - **COLD ZONE** (the cold zone): on the left, dominated by deep blue and purple tones, representing regions of low activity. - **HOT ZONE** (the hot zone): on the right and upper portion, highlighted in orange-red and yellow, representing regions of high activity. - Inside the brain, green glowing pathways symbolize neural signal transmission, extending from the brainstem upward to the visual cortex and limbic system. - The background is scattered with multiple glowing neuron cell figures, enhancing the scientific atmosphere. **The Five Core Explanatory Modules (in positional order):** 1. **Neural Substrate** - Position: upper-left corner, connected to the rear region of the brain. - Text content: "This is the stage on which dreams play out. During rapid eye movement (REM), the brain is not resting; its oxygen consumption is nearly on par with wakefulness. Anatomical structure defines the boundaries of information flow." - Visual connection: points to the brain's overall structure, emphasizing its function as the "stage." 2. **Sensory Surge** - Position: upper-right corner, connected to the right temporal and parietal lobes (the "HOT ZONE"). - Text content: "The visual cortex fires intensely, creating hyper-realistic imagery without any external light; activation of the amygdala imbues dreams with intense emotional color. This is why dreams feel so 'real.'" - Visual connection: the highlighted regions match the locations of the visual cortex and amygdala mentioned in the text. 3. **Logic Blackout** - Position: lower-left corner, connected to the brain's prefrontal region (the COLD ZONE). - Text content: "The prefrontal cortex, responsible for rationality, logic, and the sense of time and space, is in a suppressed state during dreams. This causes us to lose our 'critical thinking,' so that even when we dream of flying through the air or of time and space being scrambled, we believe it all to be true." - Visual connection: points to the cool-toned prefrontal region, reflecting its suppressed state. 4. **Random Synthesis** - Position: lower-middle, connected to the hippocampus region (toward the lower-middle of the brain). - Text content: "During REM, the hippocampus randomly retrieves memory fragments. Lacking prefrontal integration, these fragments are forcibly stitched together by the brain's 'autofill' mechanism, forming illogical narrative chains." - Visual connection: the green signal pathway passes through the hippocampus, hinting at its role in information retrieval and splicing. 5. **Consciousness Scale** - Position: lower-right corner, separate from the brain image, containing a vertical color scale and explanatory text. - Text content: "Decoding the energy distribution of dreams. High-frequency firing (warm colors) drives sensory vividness, while low-frequency inhibition (cool colors) explains the collapse of logic." - Color scale: from purple at the bottom → blue → green → yellow → orange → red at the top, corresponding to consciousness/activity levels from low to high. **Data Encoding Method:** - Uses color coding (warm colors = high activity, cool colors = low activity) to represent the intensity of brain-region activity. - Glowing points and light-flow pathways represent the direction of neural signal transmission. - Spatial layout distinguishes the "cold zone" from the "hot zone," intuitively reflecting the functional imbalance of the brain during REM. **Overall Design Style:** - Strongly sci-fi, combining biological anatomy with digital interface elements such as glowing borders, waveform charts, and a neuron-network background. - Chinese is the primary language, with English bracketed annotations for all technical terms, balancing professionalism and readability. - All text boxes use a uniform style of dark blue background with light blue-white borders, maintaining visual consistency. This infographic constructs a complete neuroscience model of dream generation, clearly showing how, during REM sleep, the brain produces dream experiences that are both vivid and absurd through the activation and suppression of specific regions.
Tags
More Images