Generate
Create images with AI
MAKE YOUR DATA COME ALIVE
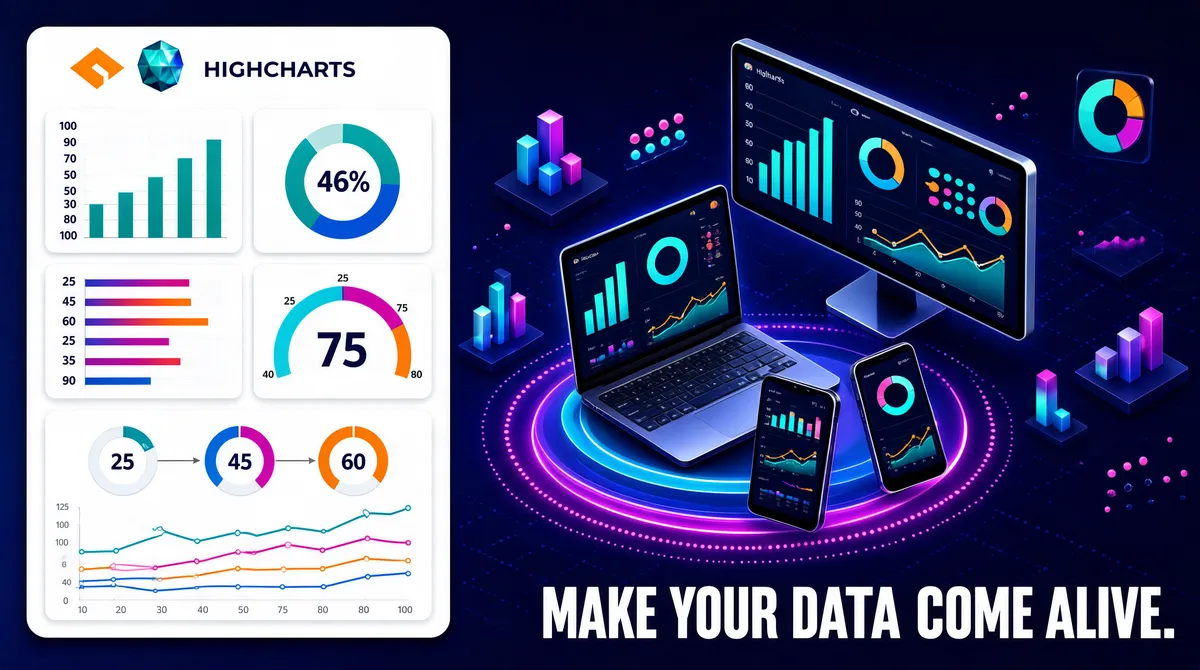
[Format] Landscape 16:9 gig cover, flat vector design blended with soft 3D isometric illustration. Crisp vector edges, smooth gradient glows, glossy highlights, high contrast on a dark base. No watermark, no personal names. [Layout] The frame splits into two unequal zones over a deep indigo-to-midnight-blue gradient carrying a faint dotted perspective grid. The left ~42% is a tall white rounded-rectangle panel, radius about 24px, inset from the edges, and inside it sits a 2-column grid of six small white chart cards with soft drop shadows and roughly 16px gutters, plus one full-width card along the panel bottom. Reading the six cards row by row: vertical teal bar chart with axis labels 10 to 100; donut chart with a large 46% centre label; horizontal orange-and-pink bar chart; concentric multi-ring arc gauge with 75 in the middle; two-series area chart in cyan and orange; and a small dot-matrix grid chart. The full-width bottom card holds three donut gauges labelled 25, 45 and 60 joined by arrows, sitting above a multi-series line chart in cyan, red and orange. The right ~58% is open dark space filled by an isometric 3D scene: a laptop at centre-left, a wide monitor behind and to its right, and two phones angled in front, each screen showing a miniature dashboard of bars, rings and line charts. Glowing magenta-purple concentric platforms and dotted ring halos sit under the devices to give depth, while faint isometric bar clusters, tiny pink dots and floating mini-charts scatter near the corners. A white headline is anchored across the bottom-right. [Subject] None — typographic and illustration only; the nearest thing to characters are the isometric devices and their floating chart fragments. [Headline] A single line of white extra-bold condensed sans, all caps, "MAKE YOUR DATA COME ALIVE." set flush-right along the bottom-right corner at roughly one twelfth of the frame height, with a period closing the line. Small unlabelled axis numbers and percentage figures sit inside the chart cards. [Badges] Top-left inside the white panel carries the Highcharts lockup: an orange angular three-lobe mark immediately left of a faceted teal-and-blue diamond gem icon, followed by a white uppercase HIGHCHARTS wordmark with wide letter-spacing, about one fourteenth of the frame width. [Mood] A deep midnight blue and indigo palette cut by electric cyan, magenta and orange accents and a bright white panel that reads as the light source. Energetic, technical and premium; at thumbnail size the white chart panel and the glowing isometric cluster pop instantly against the dark field.
Tags
More Images