Generate
Create images with AI
Healthcare Risk Management Chart
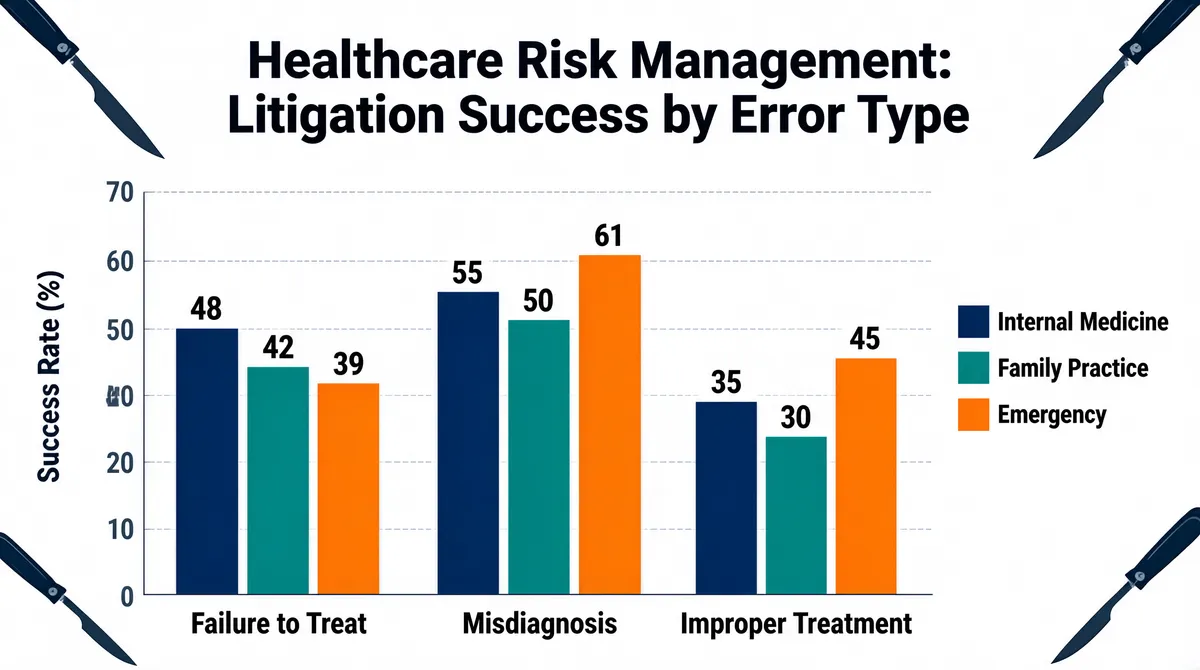
Create an infographic featuring a professional title, 'Healthcare Risk Management: Litigation Success by Error Type', centered at the top. The chart is a grouped vertical bar chart on a clinical white background. The vertical axis represents the 'Success Rate (%)' with values ranging from 0 to 70. The horizontal axis displays three error categories: 'Failure to Treat', 'Misdiagnosis', and 'Improper Treatment'. For each category, there are three bars representing different medical specialties: 'Internal Medicine' (dark blue), 'Family Practice' (teal), and 'Emergency' (orange), which are clearly identified by a legend positioned on the right side. Each bar has a numerical value label on top indicating the exact success rate. The corners of the chart are decorated with elegant scalpel vector illustrations to reinforce the medical theme. The given data is : [{"Emergency": 39, "Error Category": "Failure to Treat", "Family Practice": 42, "Internal Medicine": 48}, {"Emergency": 61, "Error Category": "Misdiagnosis", "Family Practice": 50, "Internal Medicine": 55}, {"Emergency": 45, "Error Category": "Improper Treatment", "Family Practice": 30, "Internal Medicine": 35}]
More Images