Generate
Create images with AI
Evolution of Human Vision: From Blindness to Color
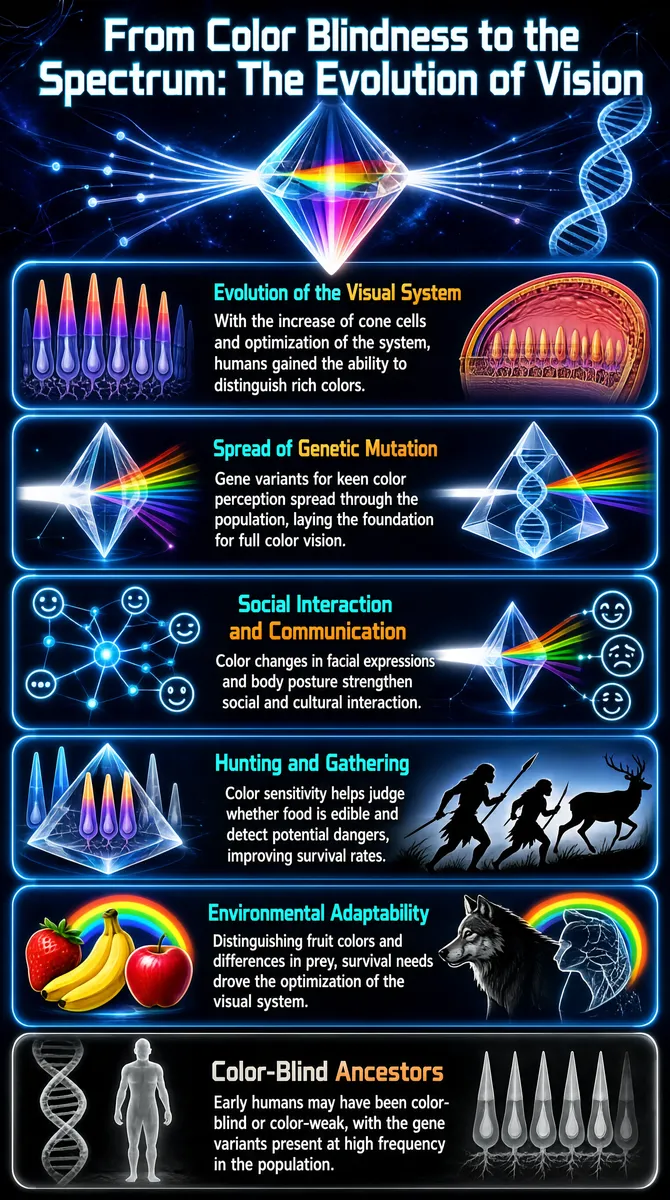
The infographic takes "From Color Blindness to the Spectrum: The Evolution of Vision" as its theme, systematically explaining the scientific process by which the human visual system evolved from a primitive color-blind state to highly developed color vision. It uses a vertically layered layout containing six core modules in total. Each module is equipped with a thematic title, explanatory text, symbolic icons, and background imagery. The visual style is strongly high-tech, incorporating elements such as a DNA double helix, neural networks, cone-cell structures, rainbow spectra, and pyramidal prisms; the background of deep cosmic blue and rainbow-gradient light effects creates an atmosphere of life's evolution and scientific exploration. The main title at the top, "From Color Blindness to the Spectrum: The Evolution of Vision," is rendered in silver-white three-dimensional lettering. Below it is a transparent cone-cell model formed by converging beams of light, refracting a seven-color spectrum inside; slender filaments of light extend from both sides, and a semi-transparent DNA double helix is visible on the right, symbolizing the link between heredity and visual evolution. From top to bottom, the modules are as follows: 1. **Evolution of the Visual System** - Title: "Evolution of the Visual System" - Explanatory text: "With the increase of cone cells and optimization of the system, humans gained the ability to distinguish rich colors." - Visual elements: On the left, an array of cone cells seen through a microscope; in the middle, a triangular prism splitting white light into a rainbow spectrum; on the right, an abstract diagram of retinal structure. 2. **Spread of Genetic Mutation** - Title: "Spread of Genetic Mutation" - Explanatory text: "Gene variants for keen color perception spread through the population, laying the foundation for full color vision." - Visual elements: In the center, a glowing DNA double helix passing through a triangular prism; on the left and right, a cone-cell structure and a retinal tissue cross-section respectively. 3. **Social Interaction and Communication** - Title: "Social Interaction and Communication" - Explanatory text: "Color changes in facial expressions and body posture strengthen social and cultural interaction." - Visual elements: On the left, a glowing neural network; on the right, a social network diagram composed of emotive faces such as smiling, crying, and neutral faces; in the middle, a triangular prism refracting colorful rays of light. 4. **Hunting and Gathering** - Title: "Hunting and Gathering" - Explanatory text: "Color sensitivity helps judge whether food is edible and detect potential dangers, improving survival rates." - Visual elements: On the left, a triangular prism reflecting red and green points of light; on the right, a silhouette-style scene of prehistoric humans hunting a deer against a dusk-toned background. 5. **Environmental Adaptability** - Title: "Environmental Adaptability" - Explanatory text: "Distinguishing fruit colors and differences in prey, survival needs drove the optimization of the visual system." - Visual elements: On the left, images of fruit (strawberry, banana, apple) and an animal (wolf) with a rainbow halo in the background; on the right, a triangular prism and a wolf-head silhouette. 6. **Color-Blind Ancestors** - Title: "Color-Blind Ancestors" - Explanatory text: "Early humans may have been color-blind or color-weak, with the gene variants present at high frequency in the population." - Visual elements: On the left, a DNA double helix; in the middle, a semi-transparent human silhouette; on the right, a black-and-white grayscale diagram of cone-cell structure, the overall tone darker to echo the "color blindness" theme. All modules are presented in rounded rectangular frames with glowing borders, and the title text uses different colors to highlight key points (such as orange and cyan). Text and imagery are tightly integrated, the logic is clear, and the modules progress layer by layer, revealing the multi-dimensional drivers and mechanisms of human visual evolution. The infographic uses no data charts or coordinate axes; instead, it conveys complex scientific knowledge by combining conceptual imagery with text.
Tags
More Images