Generate
Create images with AI
Deep-Sea Survival Evolutionary Adaptations
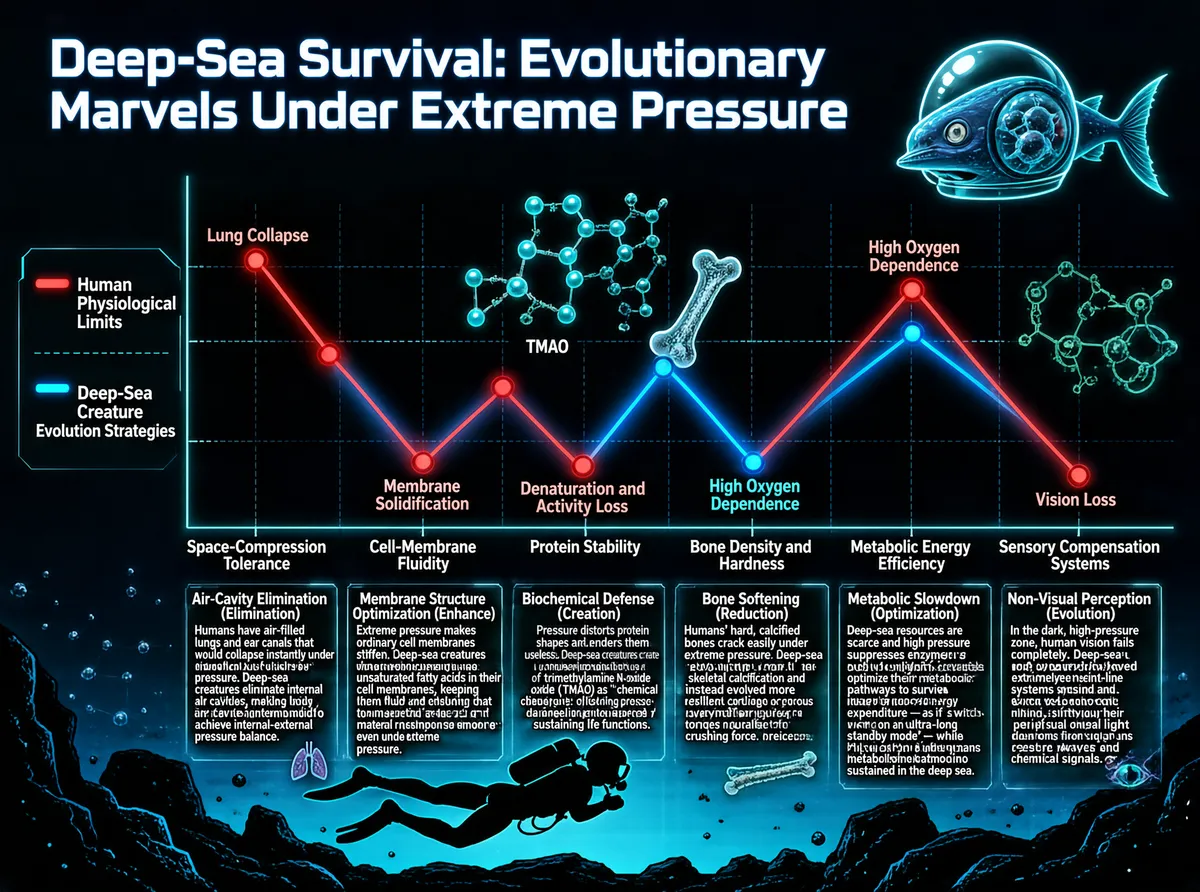
This infographic is titled "Deep-Sea Survival: Evolutionary Marvels Under Extreme Pressure," presented in a deep-blue palette with a high-tech design. The background simulates a deep-sea environment, with rock silhouettes and a diver outline at the bottom and a fish-like creature wearing an astronaut helmet drawn in the upper right, symbolizing deep-sea exploration and life's adaptation. The overall layout uses a horizontal-axis chart structure, combining line charts, text boxes, icons, and molecular-structure motifs to visually contrast, across six key dimensions, the differences between human physiological limits and deep-sea creatures' evolutionary strategies. A legend sits on the left side of the chart: the red line represents "Human Physiological Limits" and the blue line represents "Deep-Sea Creature Evolution Strategies." The horizontal axis is labeled left to right with six evaluation dimensions: Space-Compression Tolerance, Cell-Membrane Fluidity, Protein Stability, Bone Density and Hardness, Metabolic Energy Efficiency, and Sensory Compensation Systems. The vertical axis has no explicit numeric scale; instead, the height of each line intuitively indicates the degree of adaptive capability or physiological condition. Two lines in the chart each connect six data points, and each data point corresponds to a themed module containing a title, an English term in parentheses, detailed explanatory text, and decorative icons. The module contents are as follows: 1. **Space-Compression Tolerance** (first item on the horizontal axis): - Humans: the red data point sits high, labeled "Lung Collapse," corresponding to the text box "Air-Cavity Elimination (Elimination)." - Text: "Humans have air-filled lungs and ear canals that would collapse instantly under a thousand atmospheres of pressure. Deep-sea creatures eliminate internal air cavities, making body tissues filled with incompressible fluid to achieve internal-external pressure balance." - Deep-sea creatures: the blue data point sits low, with a "Membrane Solidification" label but no independent text box; the strategy is detailed in the next module. 2. **Cell-Membrane Fluidity** (second item on the horizontal axis): - Humans: the red data point sits low, labeled "Membrane Solidification." - Deep-sea creatures: the blue data point sits high, corresponding to the text box "Membrane Structure Optimization (Enhance)." - Text: "Extreme pressure makes ordinary cell membranes stiffen. Deep-sea creatures increase the proportion of unsaturated fatty acids in their cell membranes, keeping them fluid and ensuring that material exchange and signal transmission remain smooth even under extreme pressure." 3. **Protein Stability** (third item on the horizontal axis): - Humans: the red data point sits low, labeled "Denaturation and Activity Loss." - Deep-sea creatures: the blue data point sits at the highest position, corresponding to the text box "Biochemical Defense (Creation)." - Text: "Pressure distorts protein shapes and renders them useless. Deep-sea creatures create high concentrations of trimethylamine N-oxide (TMAO) as a 'chemical chaperone,' offsetting pressure's damage to protein folding and sustaining life functions." 4. **Bone Density and Hardness** (fourth item on the horizontal axis): - Humans: the red data point sits high, corresponding to the text box "Bone Softening (Reduction)." - Text: "Humans' hard, calcified bones crack easily under extreme pressure. Deep-sea creatures reduce skeletal calcification and instead evolved more resilient cartilage or porous structures, using softness to neutralize the crushing force." - Deep-sea creatures: the blue data point sits low, labeled "High Oxygen Dependence." 5. **Metabolic Energy Efficiency** (fifth item on the horizontal axis): - Humans: the red data point sits high, labeled "High Oxygen Dependence." - Deep-sea creatures: the blue data point sits high, corresponding to the text box "Metabolic Slowdown (Optimization)." - Text: "Deep-sea resources are scarce and high pressure suppresses enzyme activity. Deep-sea creatures optimize their metabolic pathways to survive on extremely low energy expenditure — as if switching on an 'ultra-long standby mode' — while humans' high-consumption metabolism cannot be sustained in the deep sea." 6. **Sensory Compensation Systems** (sixth item on the horizontal axis): - Humans: the red data point sits low, labeled "Vision Loss." - Deep-sea creatures: the blue data point sits high, corresponding to the text box "Non-Visual Perception (Evolution)." - Text: "In the dark, high-pressure zone, human vision fails completely. Deep-sea creatures evolved extremely sensitive lateral-line systems and bioluminescent luring mechanisms, shifting their perceptual dimensions from light signals to pressure waves and chemical signals." The chart also intersperses several molecular-structure diagrams (such as the TMAO structure), glowing rings, ECG-style symbols, and other decorative elements that enhance the scientific atmosphere. Through the dynamic contrast between the red and blue lines, the overall design clearly conveys the scientific fact that deep-sea creatures successfully overcome human physiological weaknesses in extreme environments via multiple evolutionary mechanisms, giving it strong science-education value.
Tags
More Images