Generate
Create images with AI
Cyclical Unemployment Infographic Guide
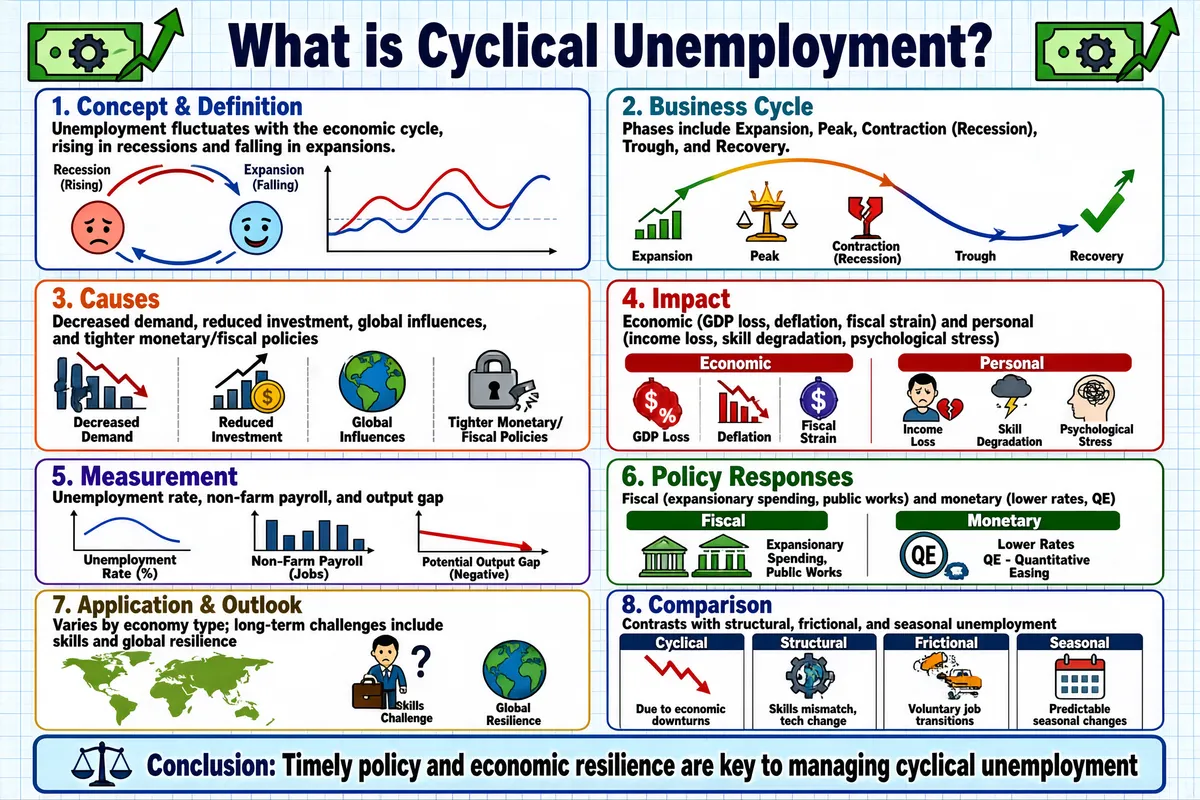
The infographic titled "What is Cyclical Unemployment?" is presented on a light blue grid background, resembling graph paper, with a clean, educational design. The title is prominently displayed at the top in large, bold, dark blue font, flanked by two identical icons: a green dollar bill with a gear and an upward-pointing arrow, symbolizing economic growth or policy intervention. The content is organized into eight numbered sections arranged in a 2x4 grid layout, each section enclosed in a colored rectangular box with rounded corners and a white inner background for text and visuals. The sections are labeled with numbers and titles in bold, with distinct color schemes for each: 1. **Concept & Definition (Blue header)** Text: "Unemployment fluctuates with the economic cycle, rising in recessions and falling in expansions." Visuals: A circular diagram shows a sad face with a downward arrow labeled "Recession (Rising)" and a happy face with an upward arrow labeled "Expansion (Falling)", connected by arrows indicating the cycle. Adjacent to this is a line graph with two wavy lines (one red, one blue) oscillating over time, illustrating the cyclical nature of unemployment and economic activity. 2. **Business Cycle (Teal header)** Text: "Phases include Expansion, Peak, Contraction (Recession), Trough, and Recovery." Visuals: A curved line graph depicts the business cycle with labeled phases: Expansion (green upward curve), Peak (yellow peak), Contraction (Recession) (red downward curve), Trough (purple low point), and Recovery (blue upward curve). Below the graph are icons representing each phase: a hand holding a sprout (Expansion), a mountain (Peak), a factory with a red arrow (Contraction), a question mark (Trough), and a sun (Recovery). 3. **Causes (Orange header)** Text: "Decreased demand, reduced investment, global influences, and tighter monetary/fiscal policies" Visuals: Four icons with labels: - Shopping cart with a red downward arrow and an 'X' → "Decreased Demand" - Factory with a red downward arrow and a prohibition sign → "Reduced Investment" - Globe with storm clouds and lightning → "Global Influences" - Bank building with a lock and dollar sign → "Tighter Monetary/Fiscal Policies" 4. **Impact (Red header)** Text: "Economic (GDP loss, deflation, fiscal strain) and personal (income loss, skill degradation, psychological stress)" Visuals: Divided into two columns: - **Economic**: - Bar chart with descending bars and a red arrow → "GDP Loss" - Red balloon with a price tag → "Deflation" - Government building with a red clock → "Fiscal Strain" - **Personal**: - Wallet with money and a red downward arrow → "Income Loss" - Brain with a gear → "Skill Degradation" - Person with a cloud and broken heart → "Psychological Stress" 5. **Measurement (Purple header)** Text: "Unemployment rate, non-farm payroll, and output gap" Visuals: Three small charts: - Speedometer-style gauge with needle pointing toward red zone → "Unemployment Rate (%)" - Bar chart with descending bars and a red arrow → "Non-Farm Payroll (Jobs)" - Line graph showing a dashed "Potential" line above a solid line, with a downward arrow between them → "Output Gap (Negative)" 6. **Policy Responses (Green header)** Text: "Fiscal (expansionary spending, public works) and monetary (lower rates, QE)" Visuals: Split into two columns: - **Fiscal**: - Capitol building with green upward arrows → "Expansionary Spending, Public Works" - Bridge under construction with green upward arrows - **Monetary**: - Bank building with a dollar sign and a yellow downward arrow → "Lower Rates" - Stack of money with green upward arrows → "QE - Quantitative Easing" 7. **Application & Outlook (Yellow header)** Text: "Varies by economy type; long-term challenges include skills and global resilience" Visuals: - World map with different regions colored differently (North America red, Europe blue, Asia yellow, etc.) - Person with a briefcase and a question mark → "Skills Challenge" - Globe with a green upward arrow and shield → "Global Resilience" 8. **Comparison (Dark Blue header)** Text: "Contrasts with structural, frictional, and seasonal unemployment" Visuals: A table with four columns: | Column Header | Icon | Description | |---------------|------|-------------| | **Cyclical** | Wave with dollar sign | Due to economic downturns | | **Structural** | Gear with cog | Skills mismatch, tech change | | **Frictional** | Two people with arrows forming a loop | Voluntary job transitions | | **Seasonal** | Sun and snowflake | Predictable seasonal changes | At the bottom, a concluding banner in light blue with a darker blue border contains the text: **Conclusion: Timely policy and economic resilience are key to managing cyclical unemployment**, accompanied by an icon of a balanced scale with a green checkmark. The overall style is modern, colorful, and highly visual, using simple icons and minimalistic charts to convey complex economic concepts clearly and accessibly. All text is in English, and the infographic is designed for educational or informational purposes, likely for students, policymakers, or general audiences interested in macroeconomics.
Tags
More Images