Generate
Create images with AI
Animated Data Visualization Poster
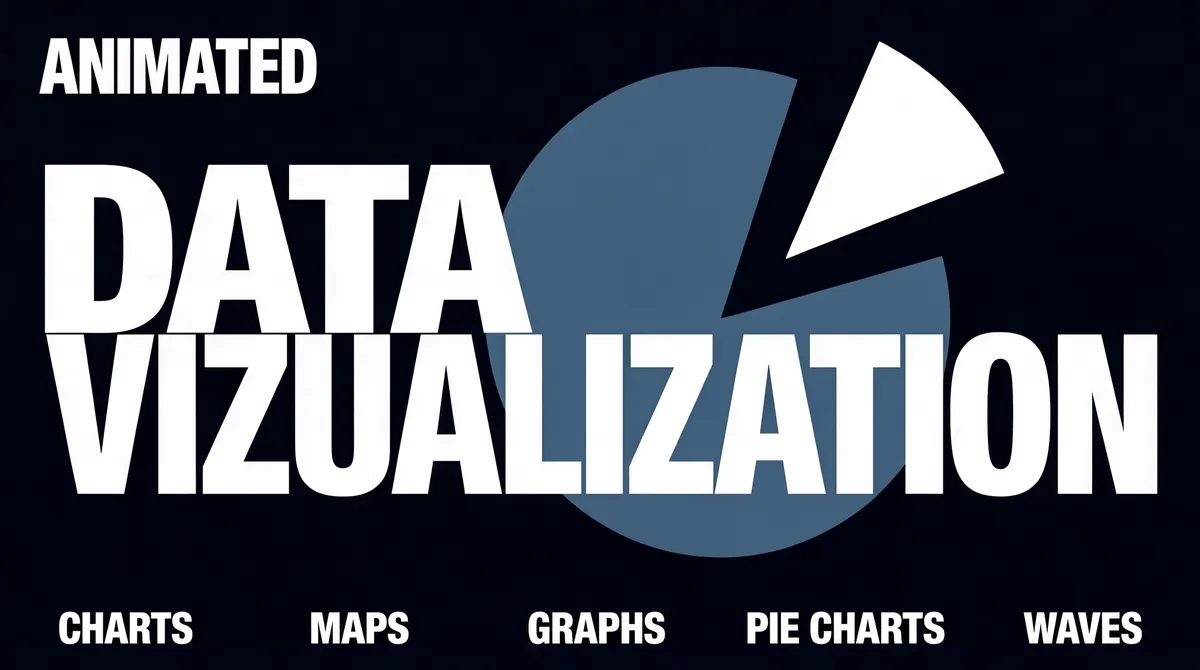
[Format] Landscape 16:9 gig cover, ultra-minimal flat typographic poster. Clean matte vector finish. No watermark, no personal names. [Layout] A single flat panel in very dark navy, almost black, with generous empty space. A huge pie-chart shape dominates the centre-right: a large circle in slate blue occupying about 55% of the frame height, centred slightly right of middle, with one white wedge slice pulled out and offset toward the top-right, the gap exposing the dark background. The typography sits on top of and beside this shape. A single row of five small labels runs along the bottom edge, evenly spaced across the full width. Everything else is negative space; no borders, no panels, no depth cues — pure flat 2D. [Subject] None — typographic only. [Headline] Top-left, "ANIMATED" in white bold caps at medium size. Centre, two stacked lines in huge white condensed extra-bold caps that overlap the pie shape: "DATA" on the first line starting left of the circle, "VIZUALIZATION" beneath it spanning nearly the full frame width. Bottom row, small white bold caps labels evenly spaced left to right: "CHARTS", "MAPS", "GRAPHS", "PIE CHARTS", "WAVES". [Badges] None. [Mood] Near-black navy, slate blue and white only; quiet, editorial, confident; the giant pie silhouette and the heavy white type keep it legible at thumbnail size.
Tags
More Images